|
Inspiration4Learning |
Math on the Edge of the Newspaper
There’s always a lot going on in the news. Every now and then, news outlets report facts in a way that isn’t quite mathematically correct. At other times, a photo or text provides a great opportunity for some math. We thought it would be nice to include a few here. This is math on the edge of the newspaper, meaning that students use a recent event to check a news story or think further based on such a story. Click on a topic to expand or collapse it. Tell us what happened in class after you tried something out. If you also see a good math prompt in the newspaper, send it to me.

|
Recently, 7 million flower bulbs were planted at Keukenhof. In many places, three bulbs are planted right next to each other in the ground. These bulbs bloom at different times, ensuring the flowerbed is constantly full and the garden looks beautiful. Spring-blooming flower bulbs are harvested after they’ve grown (around June), dried, and stored. They are planted again in October or November. If you want to store 7 million bulbs, how much space would you need: a box, a classroom, the school building, a barn the size of a soccer field? Stacking boxes is easier than stacking bulbs. Some of the students will likely start stacking small boxes. They then need to consider what happens if you increase the length, width, and height of the boxes—say, if you stack ten times as many boxes in length, width, and height. The number of boxes then becomes 1,000 times greater. Seven spaces measuring 100 by 100 by 100 bulbs is already 7 million flower bulbs. If an average bulb has a diameter of 5 cm, then you need 7 spaces measuring 5 by 5 by 5 meters. A classroom is often 7 by 7 meters and, say, 2.5 meters high. That’s roughly the same volume as a space measuring 5 by 5 by 5 meters. So 7 full classrooms should be about enough. You’ll need to fill each classroom to the brim, though. Other groups of students will likely approach this differently. They may have seen boxes of 10 or 100 bulbs at a garden center and will use those. That’s no problem. They will also determine the number of boxes needed in a classroom or calculate how large the space must be to store a large number of boxes. 
When harvesting, bulbs are often sifted (sorted by size). What happens if the bulb size doubles? The scaling question will now come up for all students. Do you now need twice as many classrooms, or do you need many more? Exactly how many? With a scaling factor of 2, the volume will increase by a factor of 8 (2³). Don’t tell them this, but give the students enough time to figure it out on their own. The scaling question also comes up with the photocopier. If I want to enlarge an A4 to an A3, what settings should I use? Or if I want to reduce an A3 to an A4. Where exactly do those numbers come from? Of course, there are many more spherical objects that are sorted by size. Think, for example, of onions and potatoes, but oysters are also sorted and named by size. 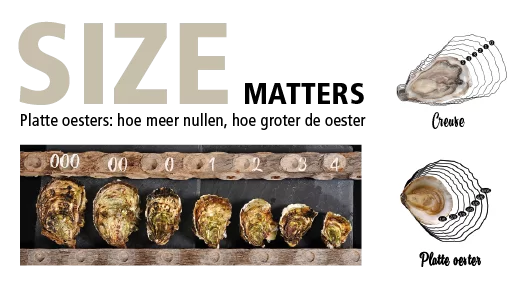
Webkwestie has developed an assignment about flower bulbs. Below, students explore how a bulb is structured, how to plant a bulb, and how to care for a flower bulb. |
|
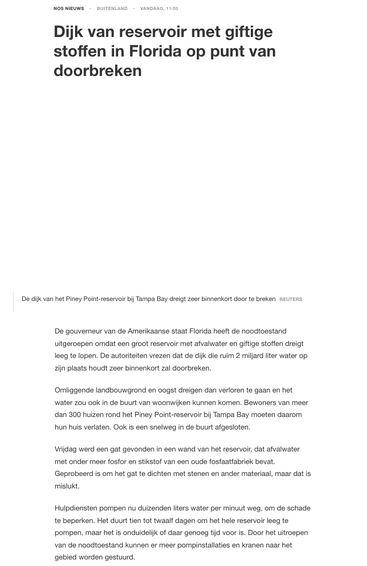
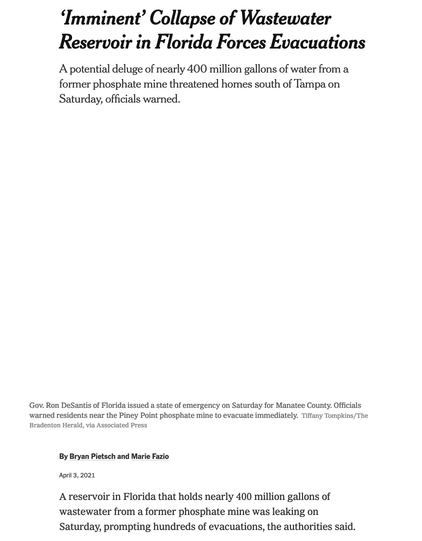
A dike surrounding a wastewater reservoir is on the verge of breaking. Efforts are underway to pump the reservoir empty in time. In its report, NOS News states that the reservoir contains over 2 billion liters of water. Thousands of liters of water are being pumped out per minute, and it will take 10 to 12 days to empty the reservoir. Moving two billion liters of water in 10 days. How many liters do you need to pump out per minute? With a number of pumps, you can move a lot of water very quickly. A small pump can move 60,000 liters per hour; larger pumps can move 3,000 m³ or more per hour. How many pumps do you need to do this in 10 days? The New York Times provides more information. The reservoir contains approximately 400 million gallons of wastewater. Between 2 and 3 million gallons of water leak from the reservoir each day. On March 26, the reservoir contained 480 million liters; on April 3, it contained 390 million liters. Currently, 22,000 gallons are being pumped out per minute. Are the numbers included in the NOS report correct? This problem calls for some quick math. You can, of course, use a calculator, but you can also estimate. If you’re going to estimate, you need to choose your numbers carefully. A day is 24 hours, but it’s easier to calculate using 25 hours. A day is 24 × 60 minutes; but it’s easier to calculate if you approximate the number of minutes in a day as 25 × 60 minutes, or about 1,500 minutes. When estimating, this problem resembles the question of who in the drawing below is a billion seconds old. 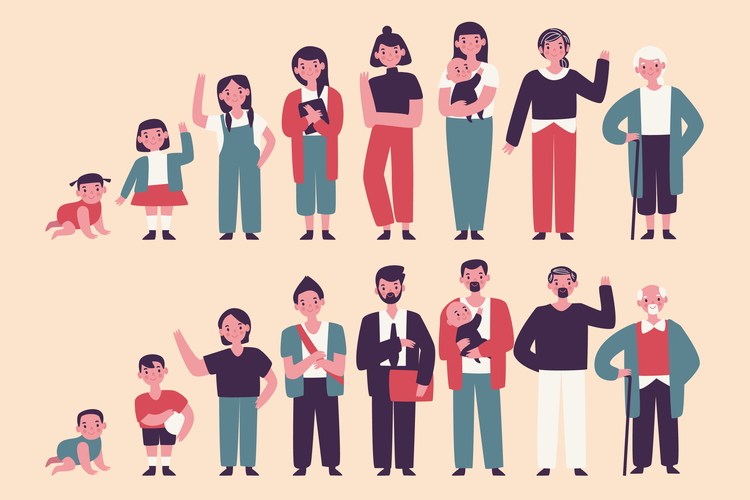
Birthdays are always fun; but you can celebrate special birthdays and special milestones in the classroom. We’re big fans of the “1-meter day”—have students keep track of when they’ll be 1 meter tall? That day is hard to predict. But the 500- or 1,000-week party, the 3,000-day party, or the 1-billion-second party can be determined exactly. Have students make their own list of special days in their lives and create a class list together. That way, they can check each other’s math. The students’ 1,000-week celebrations cannot be too far apart, and the difference in age (date of birth) indicates the time gap between when the 1,000-week celebrations can be held. Can they come up with a nice celebration for family members? |
|
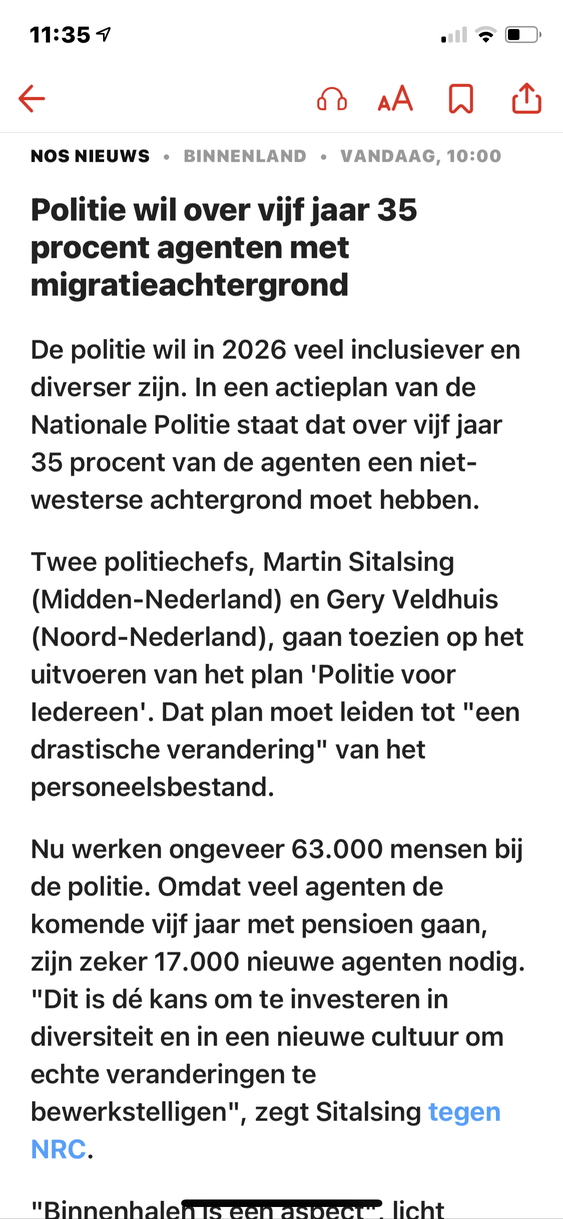
"The police aim to have 35 percent of officers with a migrant background in five years," various media outlets report. The NOS News article also notes that over the next five years, at least 17,000 of the 63,000 officers will retire. Can the police actually meet this 35% target in five years? It’s a great question for the children to puzzle over. There are several ways to look at this. Thirty-five percent of 63,000 is just over 22,000. That would only be possible if there are already 5,000 officers with a non-Western background working for the police and all newly hired officers (17,000) have a non-Western background. If 50% of the new recruits have a non-Western background (8,500 officers), then there must currently be at least 13,500 officers with a non-Western background (and who are not leaving). So it partly comes down to making some realistic assumptions. Because we don’t know exactly who is leaving and who will be hired. Students will likely also wonder how many officers with a non-Western background are already on the force. Asking good questions and clarifying your assumptions is very important. They may be able to find the answer to that last question online. On June 12, 2020, De Volkskrant reported that 7 percent have a non-Western background: "Of all police personnel—from janitors to police chiefs—7 percent have a non-Western migration background, which refers to individuals ‘with a migration background from one of the countries in Africa, Latin America, and Asia (excluding Indonesia and Japan) or Turkey’." Let’s assume that the figures from de Volkskrant are correct. 7% of 63,000 employees is 4,410 employees. If all newly hired officers have a non-Western background, then there are a total of 21,410—just under 34%—officers with a non-Western background. That will never work. It seems impossible to me to hire only officers with a non-Western background over the next five years. First, it is questionable whether there are that many candidates, but such strong discrimination in the selection process will likely provoke significant resistance. If they want to reach 35%, they would have to drastically increase the number of officers. You can do the math here, too. To raise the percentage from 7% to 35%, you’d have to hire at least 35% more officers with a non-Western background. Would the students follow this line of reasoning and explain it to each other? Let’s say 50% of all new officers have a non-Western background. How large would the police force need to become to reach that 35%? If you do the math, you’ll see that the number of police officers would have to nearly double to reach that 35% figure. So it turns out to be a nice but unachievable statement. Give the students only the data and ask if the police force will be able to achieve this. Let the students decide for themselves how they will determine this and how they will convince their classmates. |
|
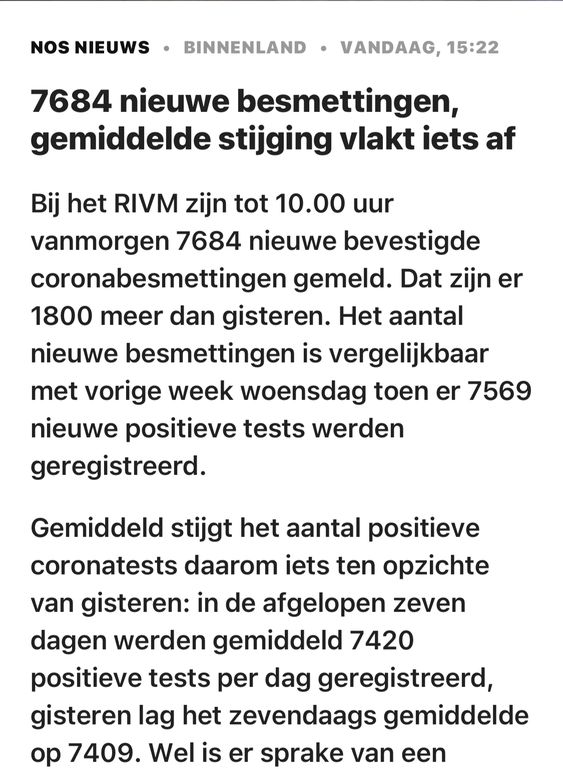
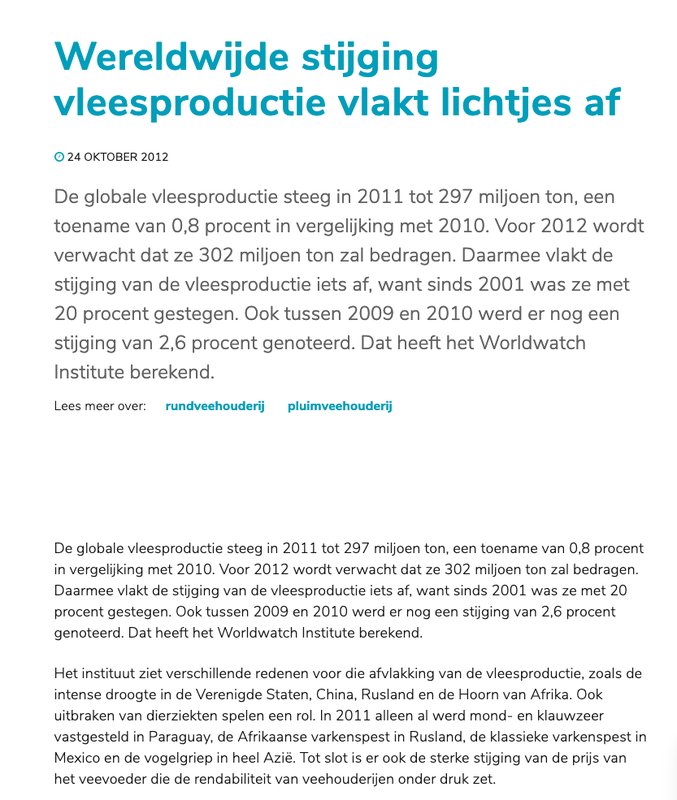
The NOS news headline reads: “7,684 new infections, rise levels off slightly.” What do they mean by that? Has the number of infections increased or decreased? Headlines like this are frequently used in newspapers. In fact, the newspapers are referring to the first derivative, but most readers don’t understand that at all. Ask the students to create a graph that could accompany this headline and have them explain why that graph reflects what the newspaper says. Also have them explain what is increasing and what is decreasing. At some point in that discussion, the students will likely start talking about the daily increase and will be able to show that this increase is getting smaller. The number is rising, but the rate of increase is falling. That’s interesting. Could they draw a graph of the increase? Of course, there are also other news stories with similar headlines: Rise in housing prices is slowing, Increase in ambulances needed on weekdays not continuing, Rise in consumer prices drops from 2.7 to 1.8 percent, Rise in number of unemployment benefits is slowing. Here are two similar reports on meat production and the number of incidents involving running a stop sign.
|

|
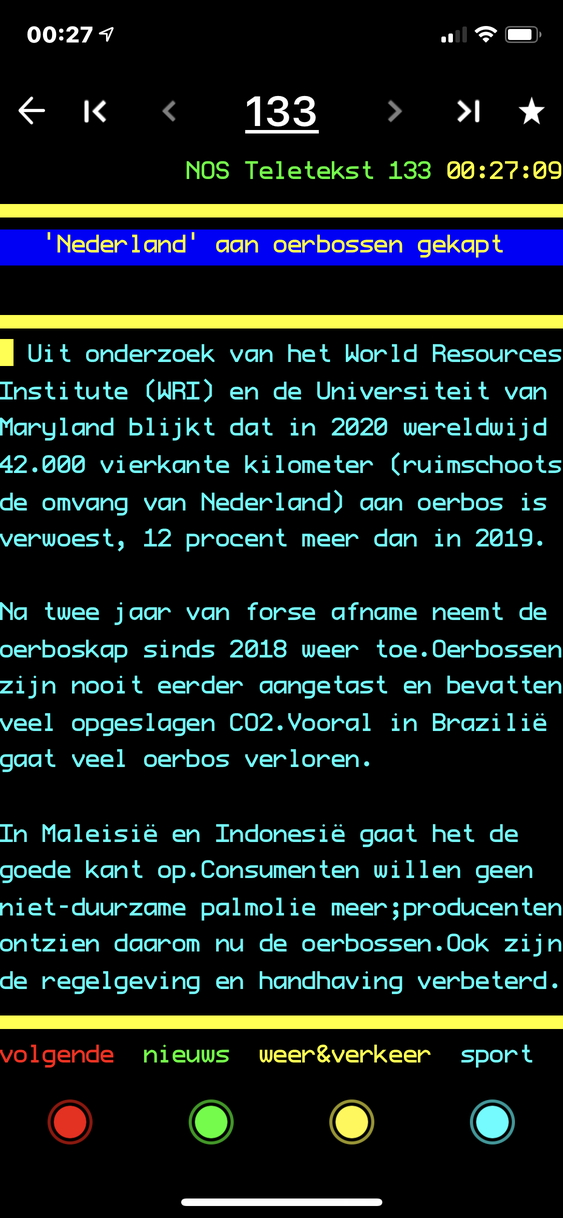
Deforestation is a serious problem that threatens biodiversity, the climate, and the ecosystem worldwide. Deforestation increased again in 2020. The NOS reports that in 2020, an area of 42,000 square kilometers (the size of the Netherlands) of virgin forest was cleared. That really hits home. How many trees would fit in the Netherlands if we demolished all the houses, roads, squares, and schools and replaced them with trees? How many trees in primeval forests were cut down last year? Now, the number of trees that would fit on 42,000 square kilometers depends on tree density. This is not the same everywhere. This is also evident from Figures c and d (below) from the article by Hoang, N.T., and Kanemoto, K. (Mapping the deforestation footprint of nations reveals growing threat to tropical forests. Nat Ecol Evol (2021).) The number of trees lost per capita is highest in Sweden, but the number of square meters of forest lost is highest in Canada. I would simply show the students the two graphs and ask them to explain exactly how this works. It is possible to draw a comparison regarding the forest density in Sweden and Canada. By the way, do you need to know the population and the size of the country to do this, or can you calculate it without knowing those numbers? 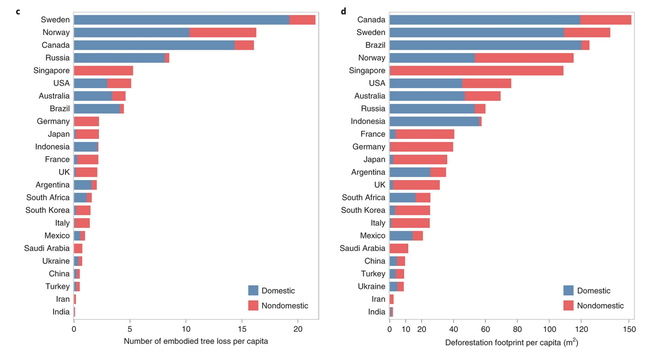
|
The National Tile-Flipping Championship has begun. This championship runs from March 29 to September 30, 2021. It’s good for nature, the climate, and the body. People always forget that it’s also good for math education. There’s plenty to estimate, calculate, and measure again. One of the goals is to flip millions of tiles and replace them with plants. Let’s assume a million tiles for a moment. How big is an area with a million tiles? First, let’s estimate: is that a classroom, the schoolyard, a soccer field, the entire municipality, or the whole of the Netherlands? Then let’s calculate: what is a million tiles? Oops, what is the actual size of a tile? The children can, of course, measure that out in the schoolyard. What are they actually measuring: the size of a single tile, or directly the size of a 10-by-10 square of tiles...? Now we can finally start calculating. Do they realize that a 10-by-10 square contains 100 tiles and a 100-by-100 square contains 10,000 tiles? In between, if the students need it, we can also introduce notation with powers of 10. 100 is also written as 10² and 10,000 is also written as 10⁴. This then leads to the question: what is 100 × 10⁴?
The tile count shows the TPI (tiles per inhabitant) and the number of flipped tiles for each municipality. This certainly calls for calculating with ratios. How exactly do you calculate the TPI? How many inhabitants do you think Zwolle has? Find a location right near your school and ask the students if the data is correct. How many tiles would you have to flip in your city to come in first? How large is that area?
|
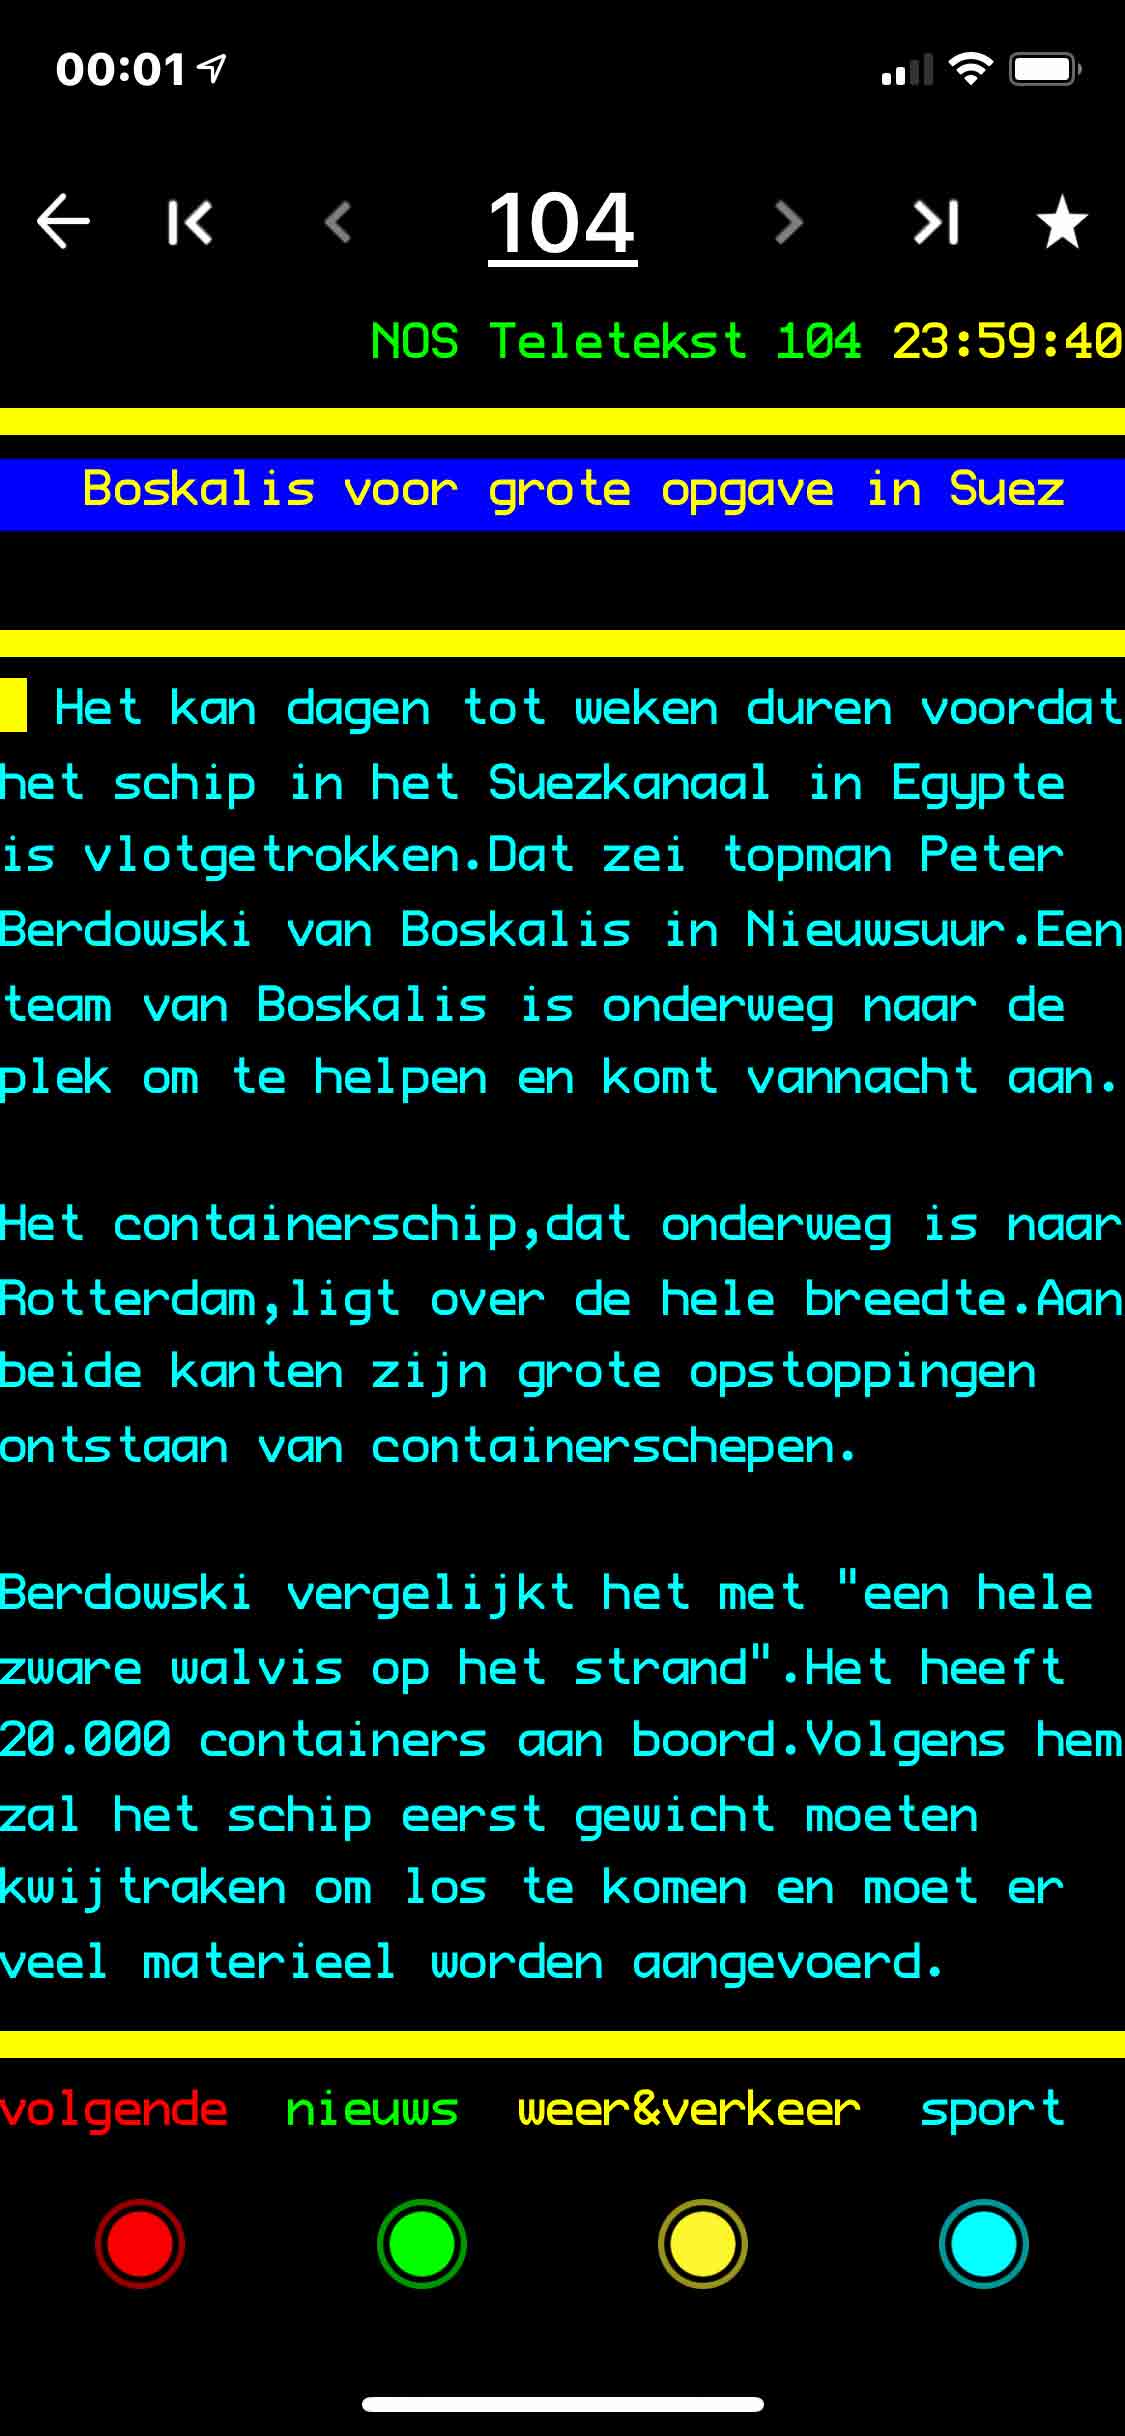
A large ship has run aground in the Suez Canal. “To pull it free, you have to do the math first,” says a director at Boskalis. That shows once again how important math is. That kind of math isn’t really for us, though. It involves buoyancy, the weight of the oil, the weight of the water on board, the weight of the containers, and the cargo inside the containers... But the reports about this ship and the photos online provide plenty of cause for wonder and calculation. The ship carries about 20,000 containers, is approximately 400 meters long, and is sitting 15 meters deep in the water. We don’t see all the containers, because some are in the hold. Approximately how many containers are stacked on top of each other? What kind of area do you need if you bring those containers ashore and stack a maximum of 3 containers on top of each other? How long is a train that transports all those containers?
|
In a radio report, a Belgian journalist described how difficult it is to combat smuggling in the ports: “The Port of Antwerp is the size of 18,000 soccer fields.” What exactly does that mean? Is the port larger than the built-up area of Antwerp? What is the approximate area of the port?
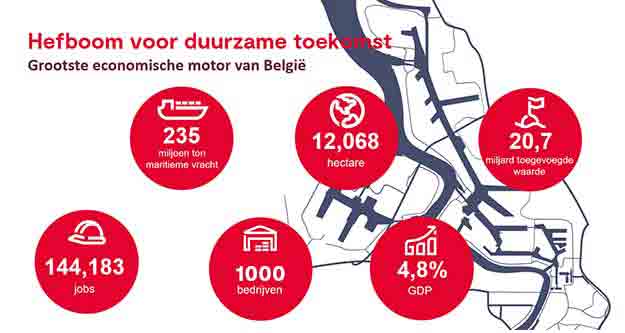
The Port of Antwerp’s website states that the port covers 11,465 hectares. Does that correspond to the idea that the port is the size of 16,600 soccer fields? By the way, do they include the water in these kinds of calculations, or are they referring only to dry land?
|
|
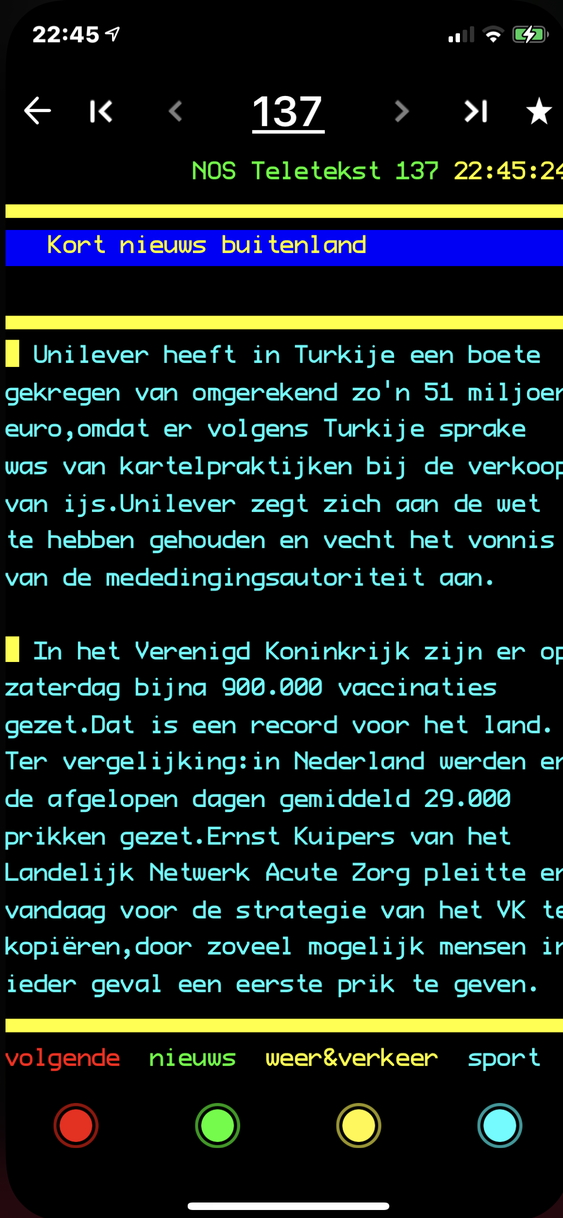
Do you add or multiply when dealing with ratios and percentages?The United States has already fully vaccinated 44 million people, according to some newspapers. In the Netherlands, 500,000 people have already received two doses. Where is the pace faster? In the United Kingdom, approximately 900,000 people were vaccinated on a single Saturday. In the Netherlands, an average of 29,000 people were vaccinated per day around that time. With all this kind of data, it’s constantly about the difference between absolute and relative numbers. In other words, ratios are flying around again. To help readers get a clearer picture faster, many newspapers publish the COVID-19 figures as the number of infections per 100,000 residents. Fortunately for us, that’s not always the case, and there are plenty of articles that give us a chance to work on ratios. Tine Degrande (a researcher from Belgium) wondered why students sometimes add and sometimes multiply when solving ratio problems. She demonstrated that students have a personal preference for one operation over the other. Among other things, she gave students the following problem: What can go in place of the question mark?:
Some students entered 8 (6+2), others entered 12 (2 x 6). In this case, both answers can be explained. However, this preference for addition or multiplication also appeared in questions where only one of the operations is correct. To investigate this, Tine presented students with questions such as:
Here, students again showed their preference for addition or multiplication. We also see this preference for an additive or multiplicative approach when dealing with percentages. Tine concluded that this preference is persistent. We must therefore continually address this in the classroom. Provide students with enough situations where one approach or the other is appropriate, and create a conflict with a corresponding discussion among the students about the question, “Why can you add here but not multiply?” or “Why can you multiply here but not add?” There are more possibilitiesOne more comment. The problem “What can go in place of the question mark?” is, from a mathematical perspective, completely uninteresting:
Mathematically speaking, any number works. For example, we can say that the point (2,4) and the point (6,?) must lie on a line. No matter what you put in place of the question mark, there is always a straight line that passes through those two points. Even if we expand the problem further, mathematically speaking, there are many more possible solutions. Consider:
It seems as if we need to add 2 everywhere. That certainly yields a valid solution; the question mark is then 12. Multiplication certainly does not yield a valid answer. However, if we also consider a parabola, for example, then more is possible. For instance, the points (2,4), (6,8), and (10,44) lie on the parabola y = x² - 7x + 14. So I could have also entered 44. And so, mathematically speaking, there are infinitely many possible answers. |
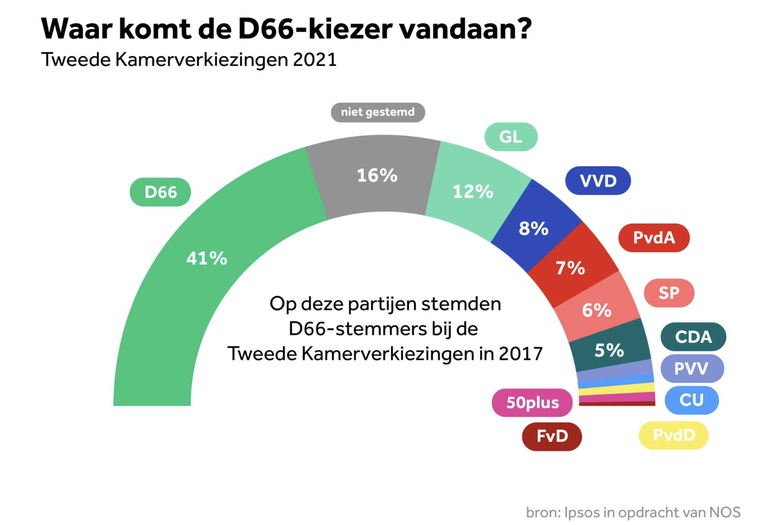
Various websites display images like this immediately after the elections. I would have my students look at these and ask them, in small groups, what stands out to them. At some point in the discussion, I would mention that I always thought 100% was a full circle. Why do they only show 50% here? Playing devil’s advocate is such a great role for a teacher.
After we’ve discussed this, I’ll show them a chart of the election results for all parties. This chart comes from Wikipedia and shows only the 2017 results.
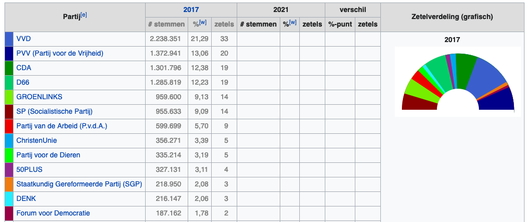
Once again, the arc represents the total number of votes. Now we can indicate both the percentage of votes and the number of seats per party. This results in a nice double number line.
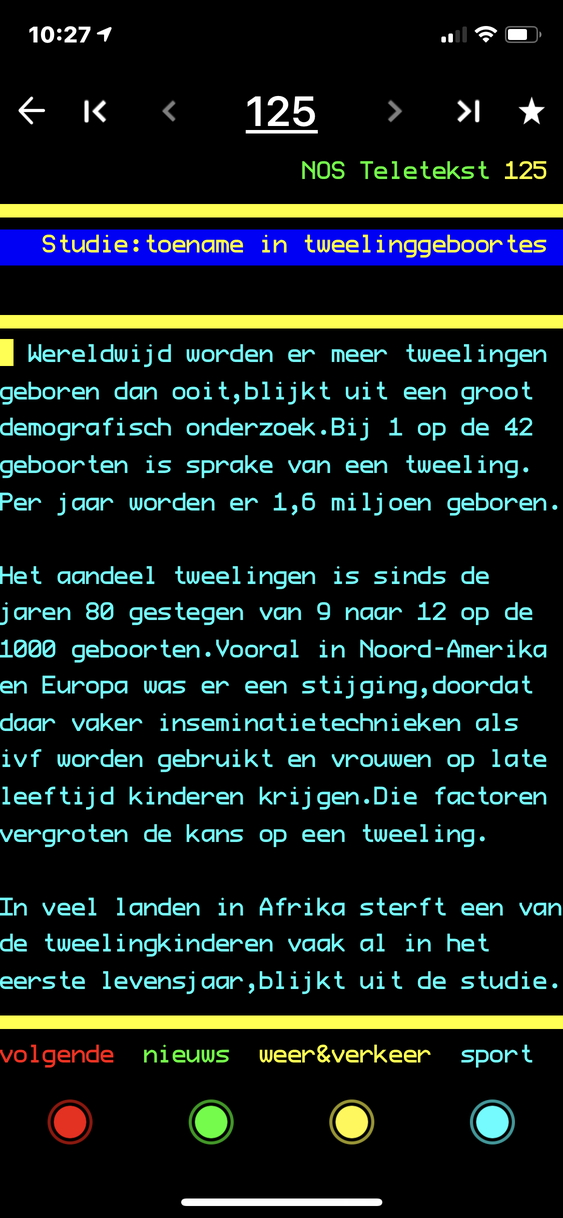
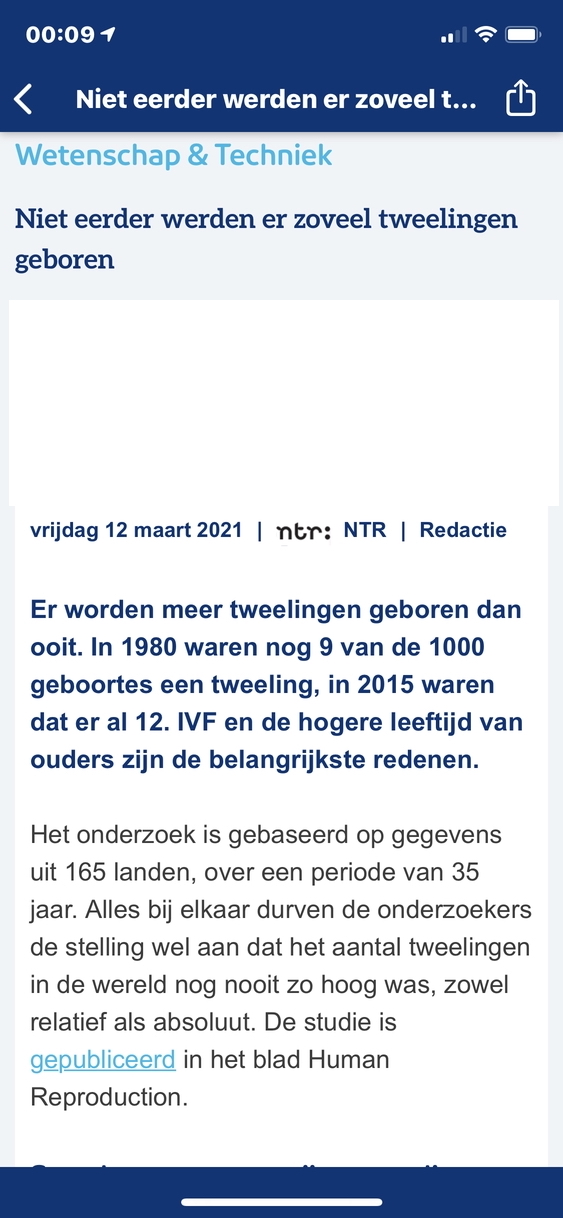
Various news outlets report that more twins have been born in recent years. Of course, every newspaper uses different numbers in its article. The question is whether those numbers really differ. The NOS states that 1.6 million twins are born each year. This report also says that 1 in 42 births involves twins. However, the NTR says that in 2015, 12 out of every 1,000 births were twins. Could all of that be correct?
Of course, this means that students must compare 1 in 42 and 12 in 1,000. But there is also the question of whether that figure of 1.6 million twins per year can be correct. We can calculate the total number of births per year if we assume that 12 out of every 1,000 births are twins and that 1.6 million twins are born. But does that roughly match the size of the world’s population? How can you verify such a number?
|
|
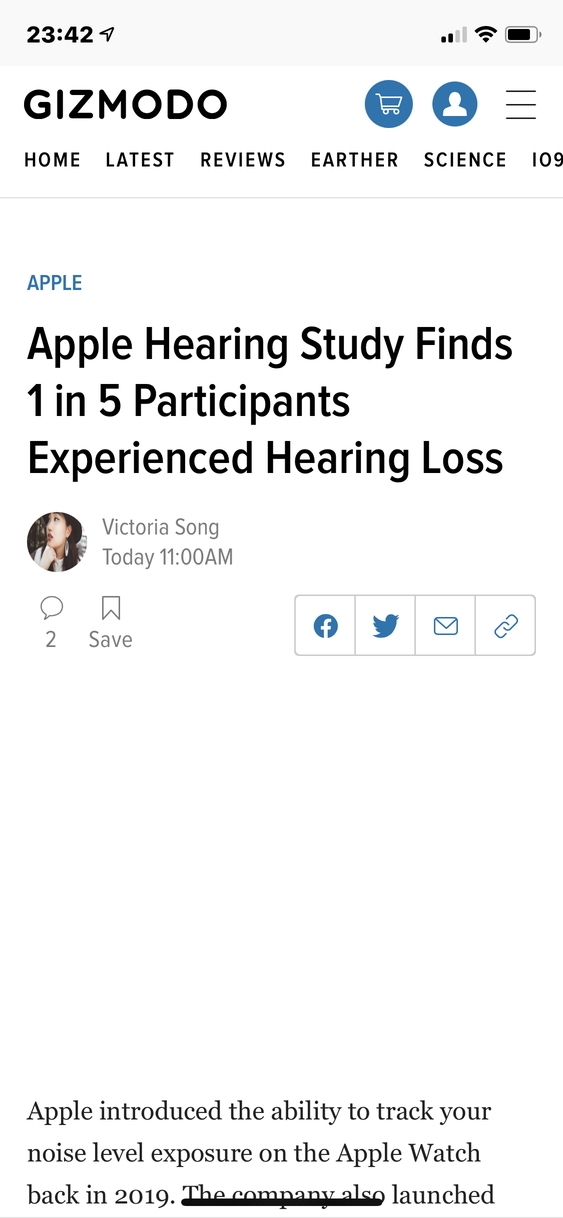
Apple is becoming increasingly active in the healthcare sector. Now, it’s possible to use an Apple app to check if you have hearing problems. Most people with hearing problems would probably want to try that out. They usually want to know how serious the problem is. Apple recently reported that 1 in 5 participants has some degree of hearing loss. What does this mean? Does 20% of the world’s population have hearing loss? It’s always good to discuss these kinds of articles with children. The key question here is always: what is the total? That’s always an important question, and children often don’t pay enough attention to it. It’s important when dealing with percentages, fractions, and everything else. In this case, it’s hidden in the word “participants.” People who experience hearing problems are more likely to participate in this test than people who do not experience hearing problems. The group is therefore not a good representation of society as a whole. This is also the case with, for example, COVID-19 tests. If 11% of the people tested are positive for COVID-19, you cannot conclude that 11% of the population will test positive. The question "what is the whole" also comes up in famous scenarios such as:
"What is the whole?" is a big idea. You can never pay enough attention to it in class. The questions above aren’t the best ones to bring this up in class. It’s better to look for bigger problems where this comes up repeatedly. |
|
|
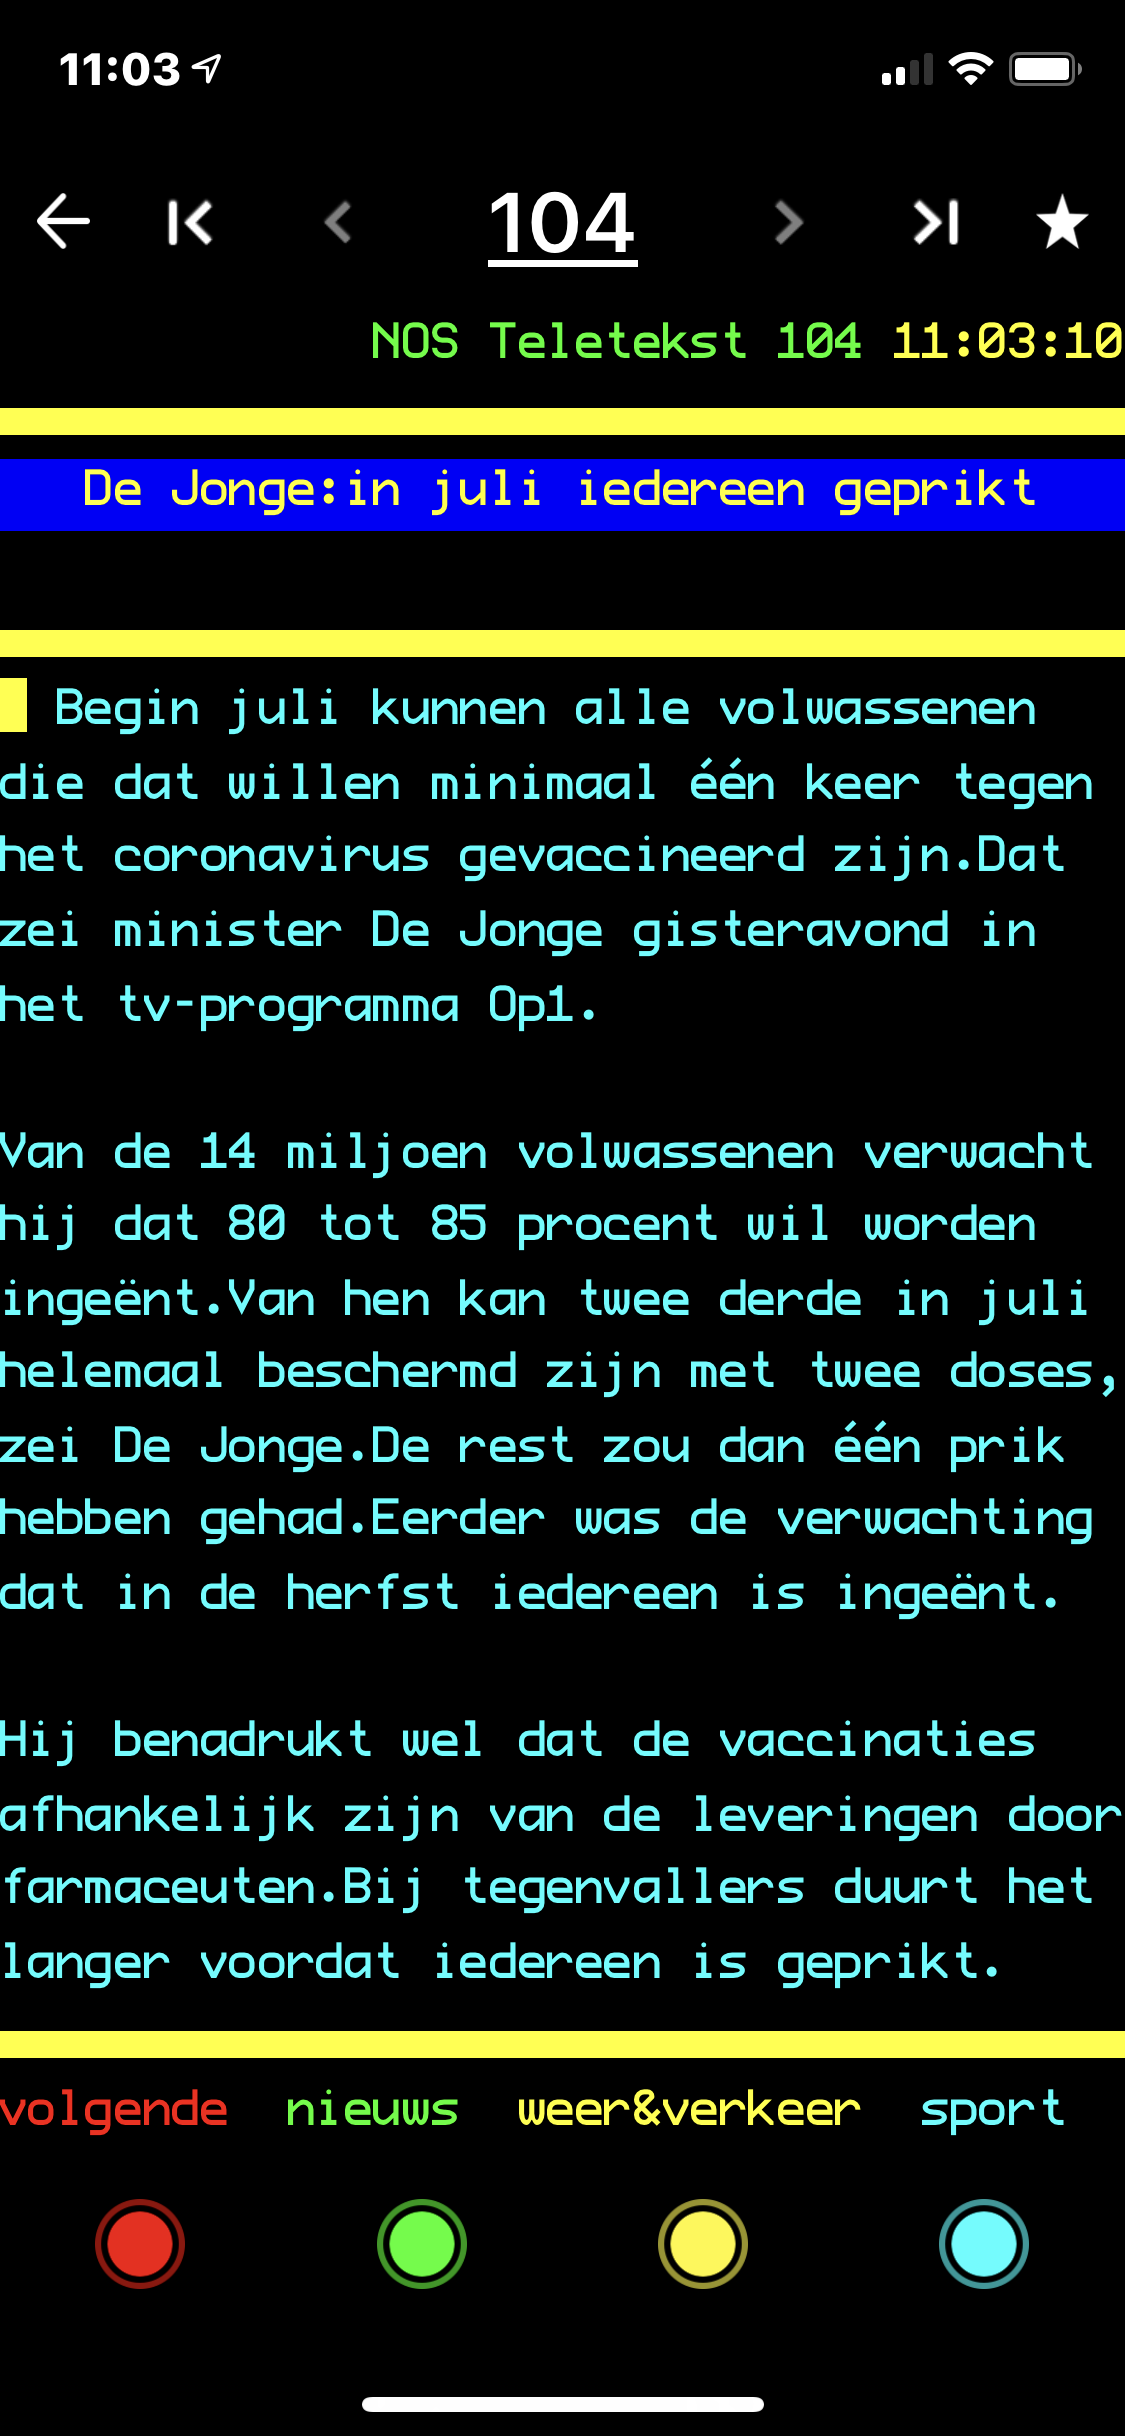
NOS Teletekst showed on the same day how the question “What is the whole?” is important in a somewhat more complex setting. Minister de Jonge states that two-thirds of 80 to 85 percent of adults will be fully protected against Covid-19 by July. The article describes this in a few steps.
What percentage of the Dutch population will be fully protected by July? That requires quite a bit of thought. Two-thirds of 80–85 percent of adults. How many Dutch people is that? Or what percentage of the 17 million Dutch people is that? To fully understand this situation, students need to realize that there are three different groups involved: all Dutch people (17 million), all adults (14 million), and 80–85 percent who want to be vaccinated (between 11 and 12 million). Can you then say that it is 2/3 of 80 percent? Can you multiply here? Why exactly? |

The NOS reports that “an international team of scientists has succeeded in reading an unopened letter from the seventeenth century using scanning technology. The letter was found in a suitcase belonging to a postmaster from The Hague from that era; it never reached the recipient.” The NOS wasn’t the only one to report this. It was global news.
The article states that “the letters were not ‘packaged’ in an envelope; that invention did not come along until the nineteenth century. At that time, the paper served as its own envelope. People devised all sorts of ways to fold the paper. This had everything to do with the content: if the letter contained sensitive information, senders tried to seal the mail securely so it couldn’t be read surreptitiously. There were thus countless ways to fold and seal the mail: known as letterlocking. "The folding was as personal as the sender’s signature."
Various websites provide information on folding and sealing a letter. On IBookBinding, you’ll find several videos demonstrating the process of folding and sealing.
Challenge the children to write a story on one side and fold it and seal it with tape so that other children cannot read the text. What kinds of folds can they come up with, and how do they know the letter is then unreadable?
With folding, it’s even possible to develop a language. The folds people used in the past were very personal. You could tell who had folded the letter; it thus functioned as a kind of signature. The way Surinamese headscarves—the angisa—are folded also forms a language. Women can use this to convey messages and emotions. Speaking of language. In the Netherlands, millers had developed a language by setting the mill’s sails in a specific position.
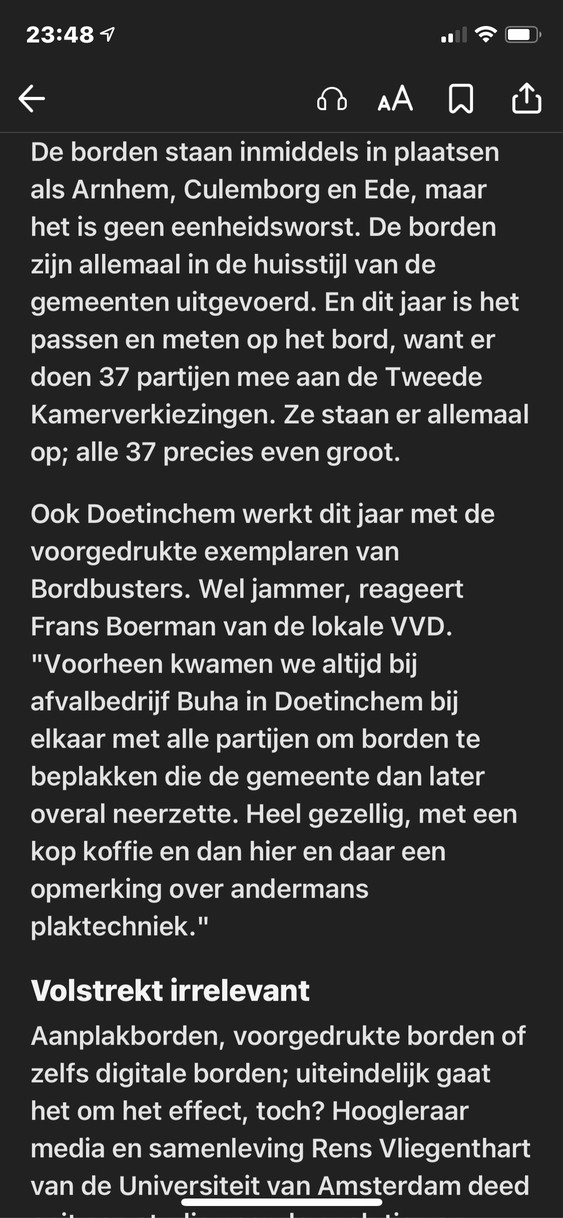
A record number of parties are participating in this year’s House of Representatives elections. This has created some new logistical challenges. Photos of these signs can be found everywhere. The NOS app even reports: “And this year, it’s a matter of fitting everything onto the sign, because 37 parties are participating in the House of Representatives elections. They’re all on there; all 37, exactly the same size.”
But if you look at the photos, there are never 37 parties on them. How should such a billboard be arranged to fit all 37?
37 is a prime number. It is not possible to fill the board with, for example, 4 rows of 9 posters, 5 rows of 6 posters, or 3 rows of 7 posters and still display exactly 37 parties. The students will likely try various combinations and eventually realize that 37 cannot be factored. That’s a great moment to celebrate that insight and then ask if there are more numbers that cannot be factored. Or to challenge them to create a “fair” design for the election board.
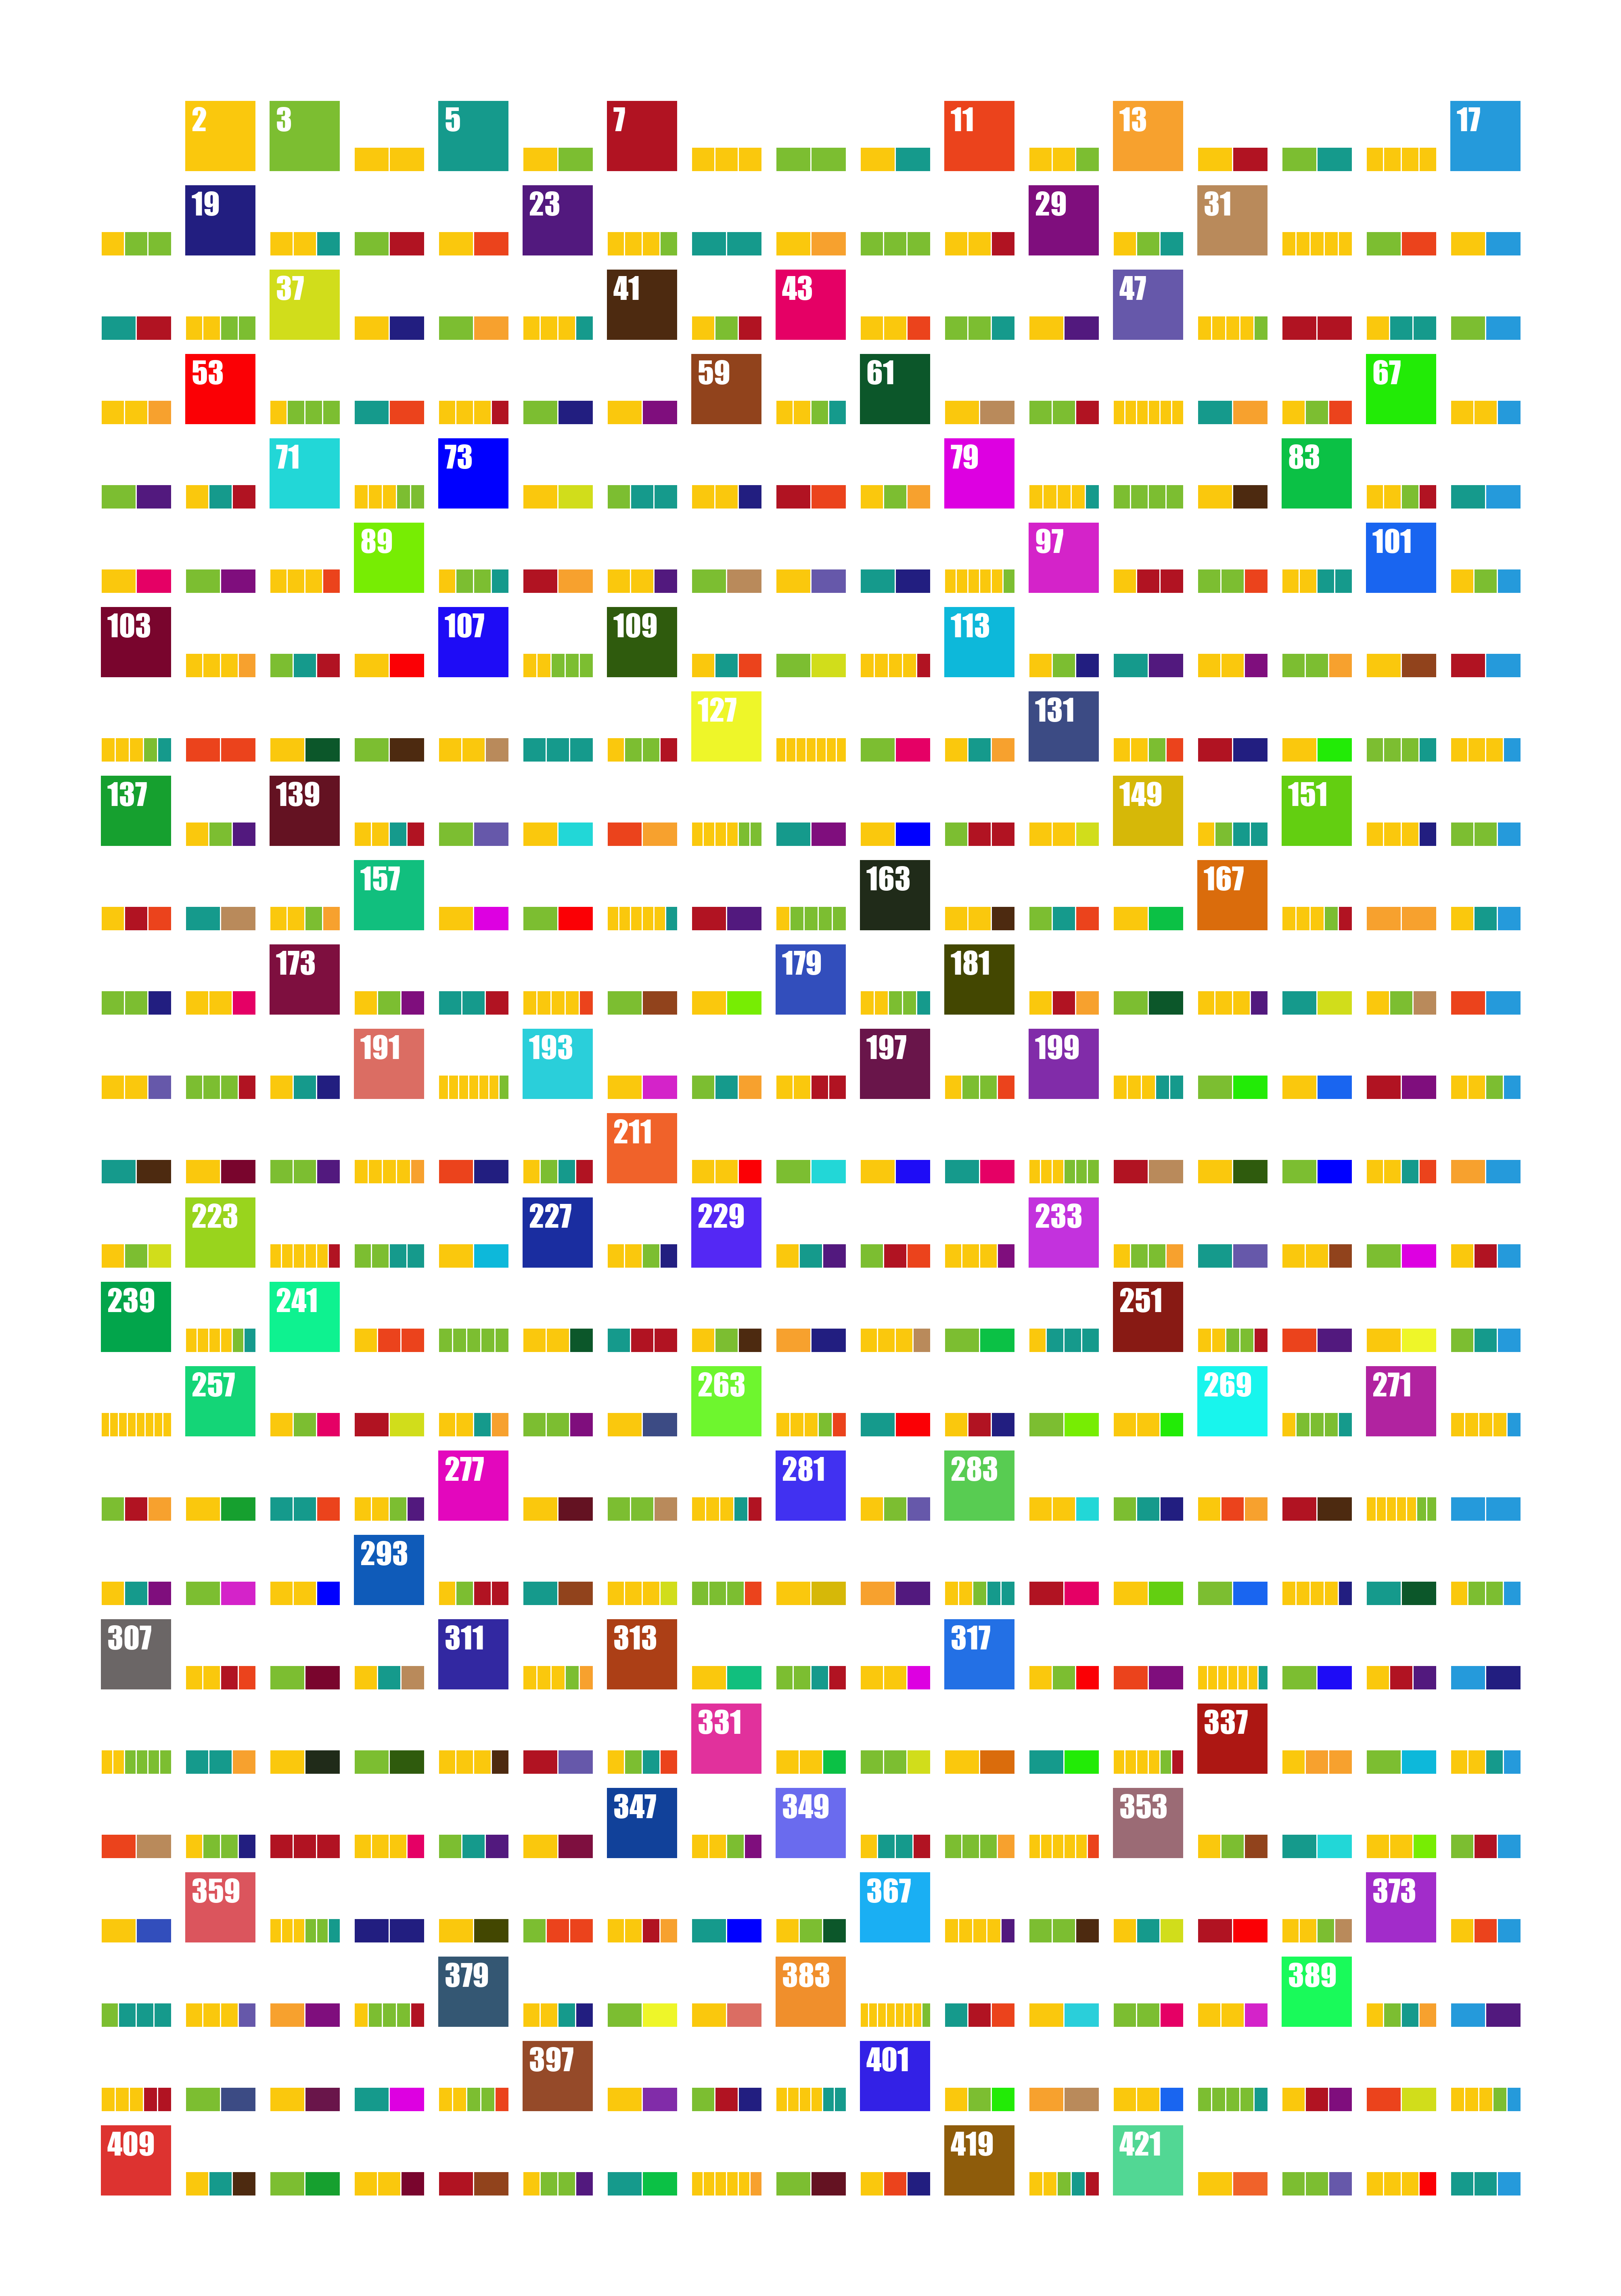
For IDM 2021, Aubin Arroyo from Mexico created the poster below about prime numbers using Python. Aubin says, “These numbers make the world a better and happier place; at least you don’t have to worry about them when you have to learn your multiplication tables in school.” On the IDM website, you can also view other posters and read about who the creators are and what they were thinking when they made them. You can have the students discuss this poster at some point. What do they see? What stands out to them? How did Aubin know these were the numbers? What would the next number be? How can you find more numbers?
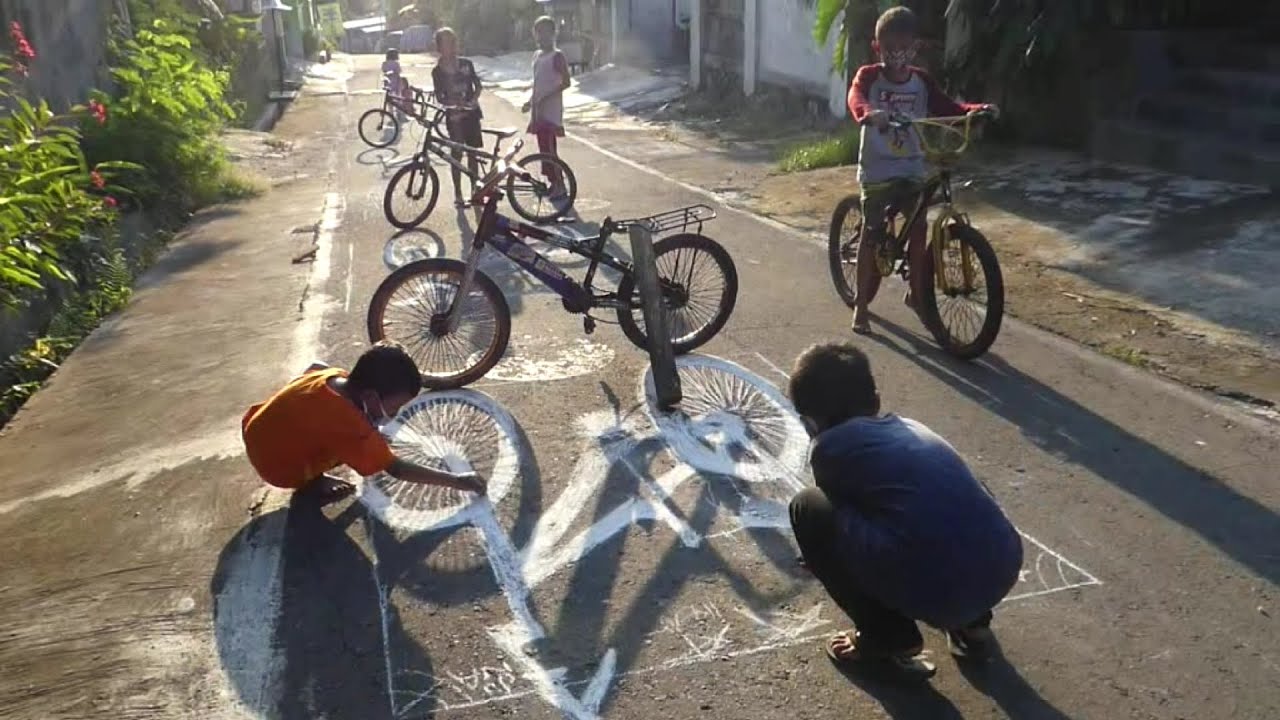
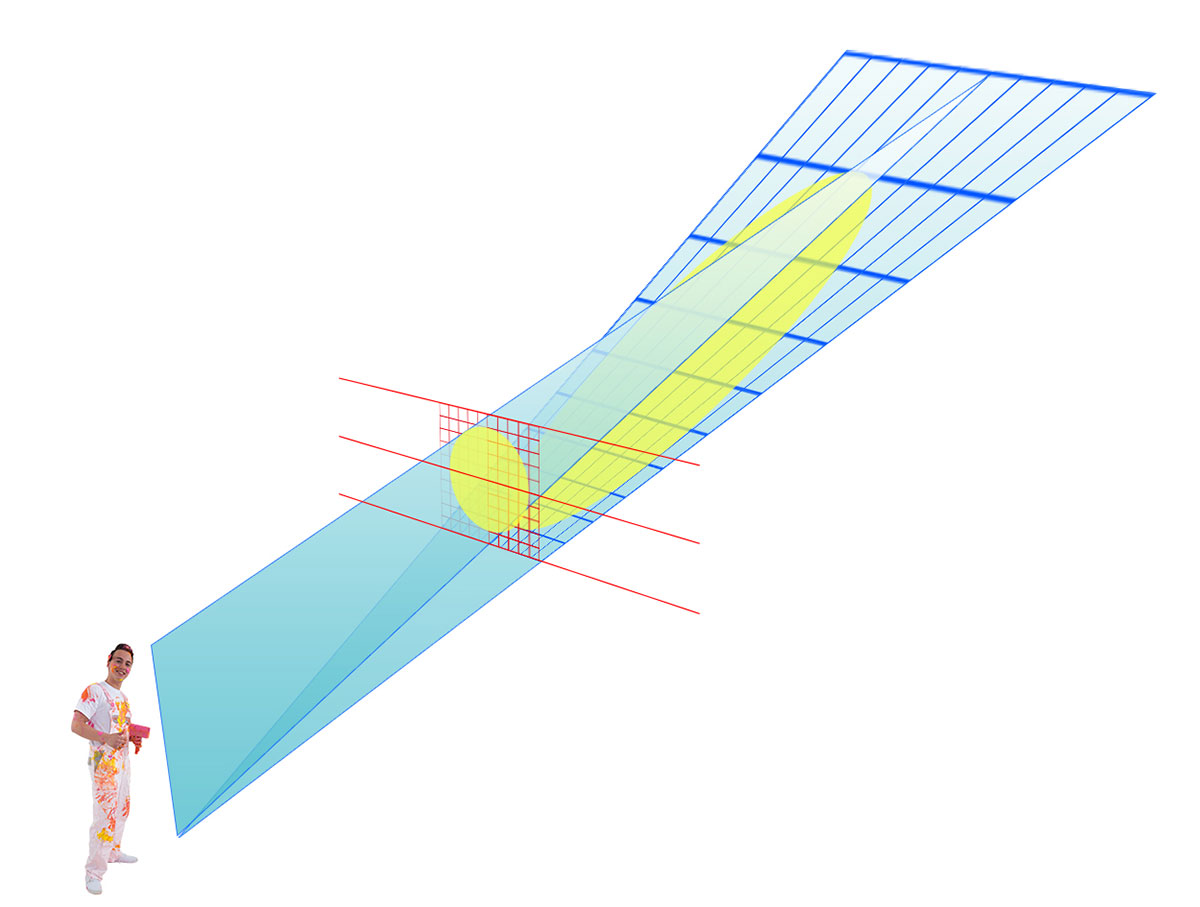
The Jakarta Post recently featured a fun photo of children drawing the shadow of a bicycle on the street. However, that drawing isn’t a real bicycle; the proportions are “wrong.” Is this an anamorphosis? The concept is clearly illustrated in the following sketch by the firm Drukwerkdeal. You can create an anamorphosis by drawing an object on a grid and then removing that grid.
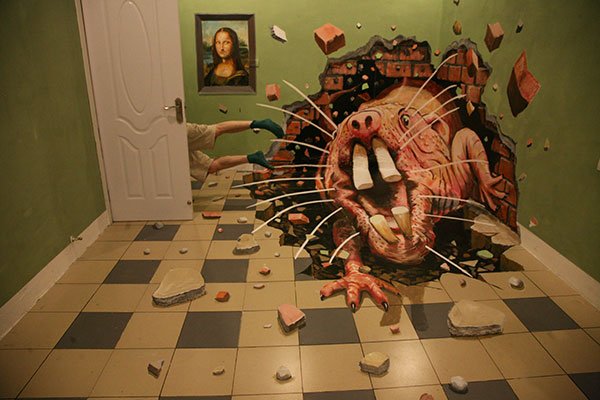
The bicycle on the sidewalk is viewed from a very distant vantage point (the sun). If you look at it from a different angle, the bicycle appears distorted. You can also see this in Julian Beever’s drawings. The photo of a mole rat emerging from the wall illustrates this beautifully, Julian Beever.
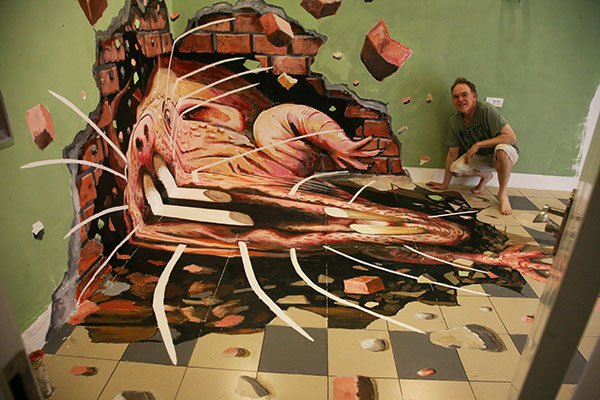
Students can rediscover a lot of visual geometry when they carry out these kinds of light and shadow activities in the schoolyard. Have them draw a bicycle. They’ll see that the drawn bicycle looks different from the real one and that the shadow grows larger over time. What about a tabletop? Set a table outside and have a child use a different color every hour to draw the shadow of the tabletop on the tiles. At the end of the day, of course, you’ll all look at how it turned out. Has the size of the tabletop changed? Is it still a rectangle? What about the shadow of a tabletop when we shine a strong lamp on it in the classroom? Can I distort the shadow?
Windmills have long been part of the Dutch landscape. You see all kinds of windmills in cities and in the countryside. We used polder mills to pump water. We had industrial mills to grind flour, saw wood, extract oil from seeds, or to make paper, for example. Nowadays, the old mills mainly serve a cultural purpose. To generate energy, we use different types of mills. These are taller and slimmer.
There are all sorts of objections to wind turbines: they make a lot of noise, they cast annoying shadows and cause vibrations, they’re bad for public health, they’re ugly, they obstruct the view, and they lower property values in the surrounding area... I’m not going to judge whether these objections are justified or not. I just want to look at the argument that they’re so big. A wind turbine is tall; after all, that’s where they catch the most wind. How tall is a wind turbine? Or to put it another way, how big does a wind turbine look when it’s built some distance from your house?

I myself live 50 meters from an old windmill. The platform—that is, the walkway the miller walks on—is 18 meters above street level. The span of the mill—that is, the distance from one blade tip to the tip of the opposite blade—is 25 meters. So the highest point of the mill is about 43 meters above street level. Does this mill now seem larger or smaller than a 200-meter-tall wind turbine being built 900 meters from my house?

Potential locations for wind turbines near IJburg
One place where the debate over windmills is taking place is IJburg near Amsterdam. De Volkskrant shows a map of potential sites where a windmill could be installed. The height could reach 200 meters. You could introduce an investigation by talking about the neighborhood residents and their fear of visual pollution. The residents would like to understand how large those windmills will appear; that is, they want to be able to imagine what those windmills will look like on the horizon when they stand in front of their own homes.
There are many questions and issues regarding sightlines. Let me describe another situation that children may have noticed or that they’ll recognize when you mention it. When you’re cycling toward a town or village from a distance, you can see that single high point (church tower, apartment building, bridge, windmill) very clearly. It towers above all the houses. But once you’re in the town (village), that high point is often no longer visible. The question, of course, is exactly why that is.
| ©2026 Inspiration4Learning — All rights reserved |
