|
|
Inspiration4Learning |
Ideas for a math lesson
Click for more information
Here we provide all kinds of ideas for a math lesson. Click on a topic to expand or collapse it. Tell us what happened in the classroom after you tried something out. If you have a great math project, please send it to me.
March 14 is International Day of Mathematics (IDM). In 2021, they also held a poster contest. The central challenge was to create a poster that conveys an idea of how we can make the world a little better while using mathematics as a universal language. This resulted in a collection of beautiful posters.
The maps we know are a projection of the Earth onto a flat surface. Common projections distort the size of a country; Greenland is often depicted as much larger than it actually is compared to, for example, Africa. There are maps that provide a more accurate representation of countries. It might even be better to have children look at a globe to give them an idea of a country’s true size.
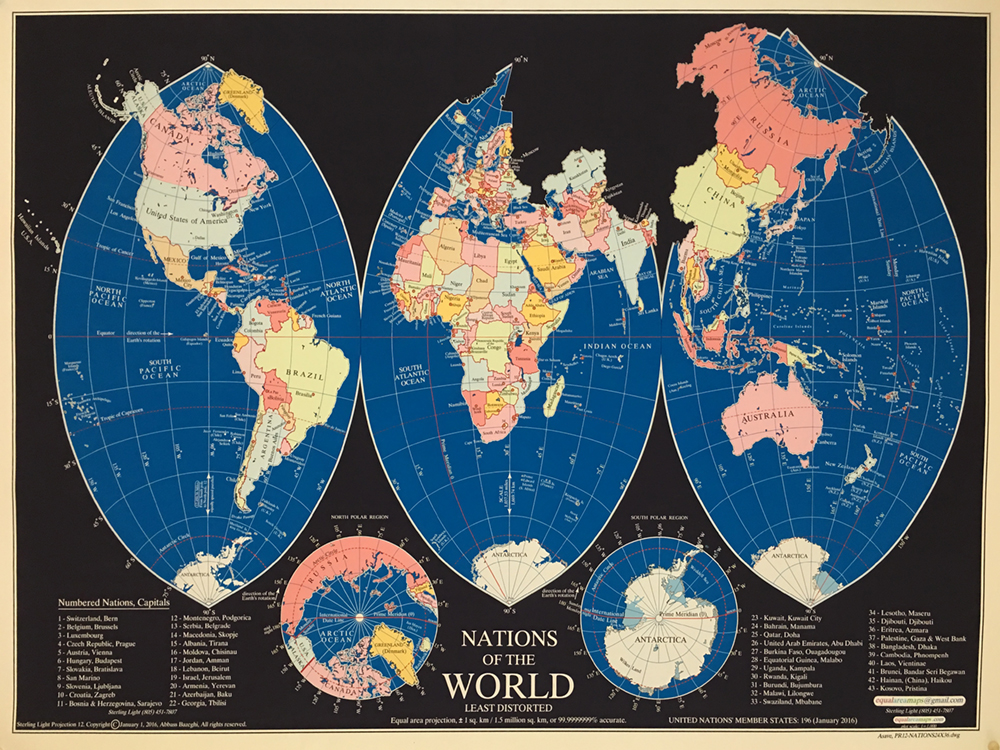
The least distorted map of the world.
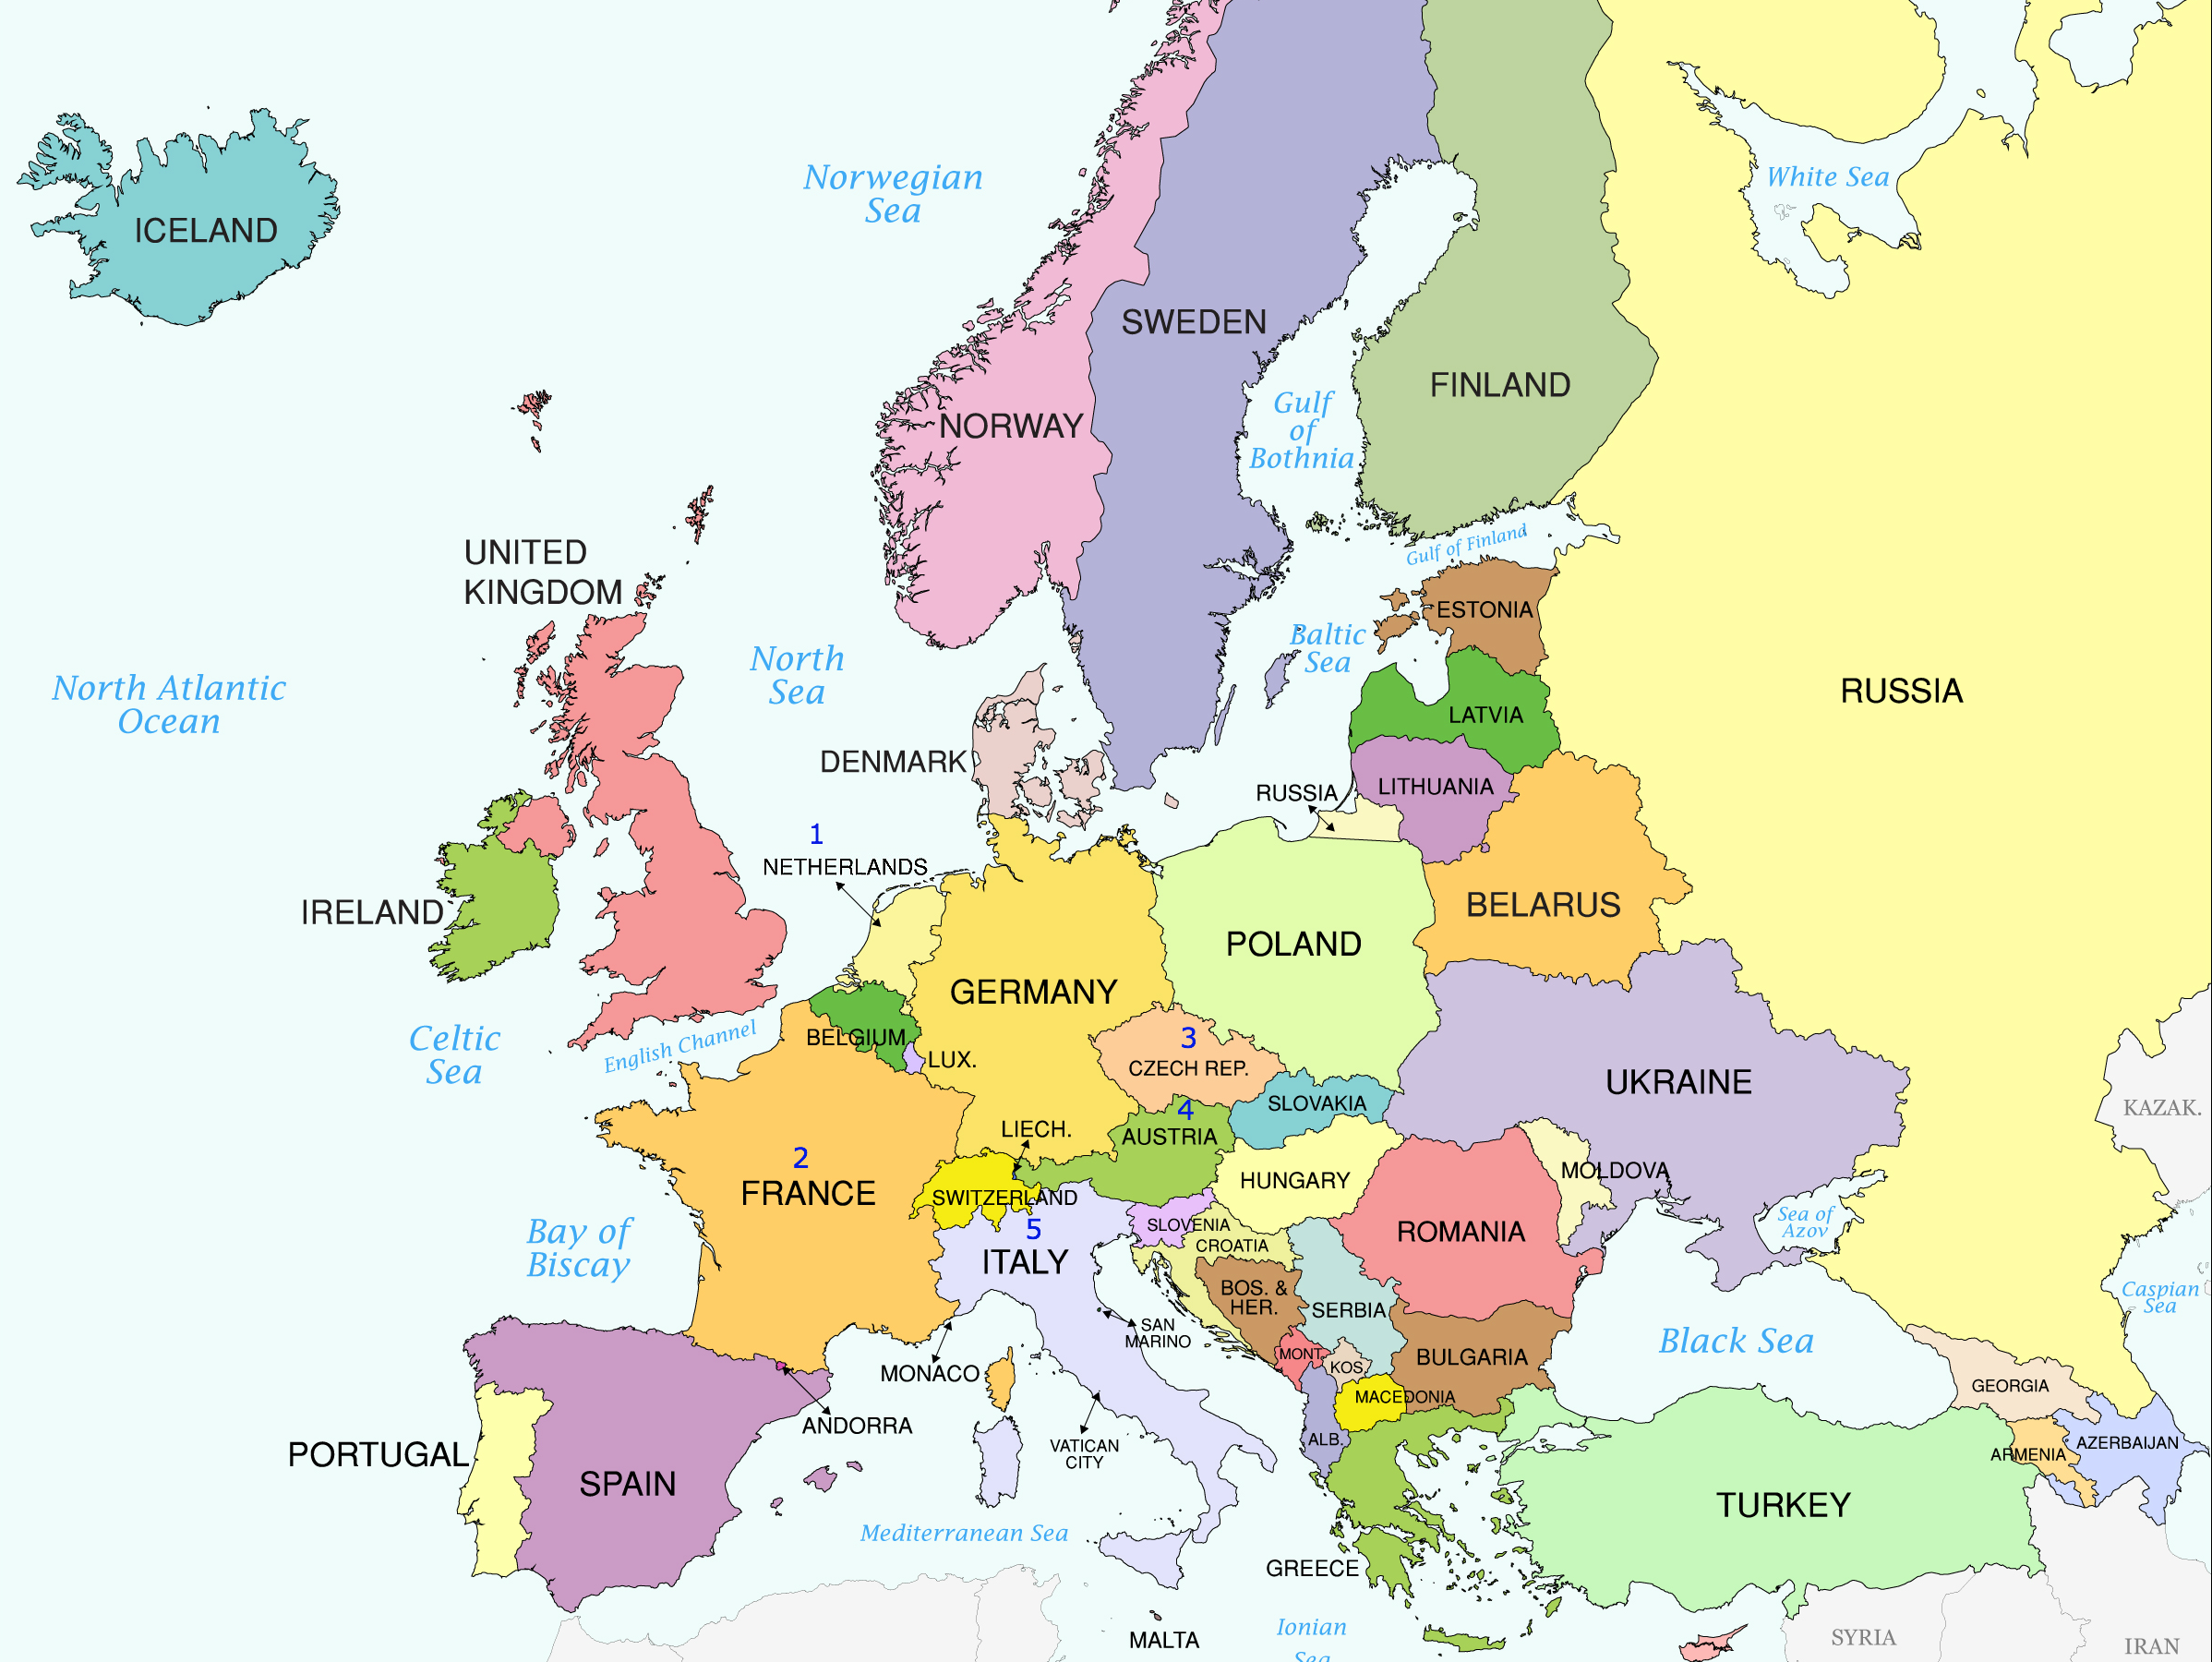
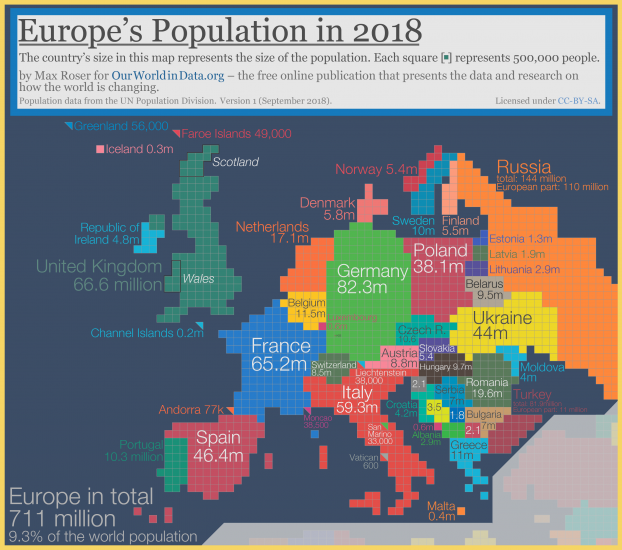
However, maps can also be drawn based on other criteria. Max Roser redrew the continents and used population as a measure of a country’s size. This gives a different view of Europe. Just compare these two maps.
|
|
The Netherlands has suddenly become a lot bigger. Norway, Sweden, and Finland, which look so large on the standard map, are suddenly a lot smaller than the Netherlands. In the map on the right, each country is made up of squares. What is the value of each square? How large should China, India, Indonesia, or Nigeria be depicted?
You can also have the children draw their own maps. There are many ways to create a map. Have all the children, either individually or in small groups, make a list of all the countries in Europe. From memory, of course. The point is for them to know every country. We can then color Europe according to how well-known each country is. The most well-known country becomes dark green; the least well-known country we color very light green. The children must decide for themselves how they will use shades of green.
Closer to home, you can have the classroom mapped out in various ways. This is an idea that Bram van Houten described in a blog post on Op Scherp. The children can color the classroom floor plan from least crowded to most crowded, least cluttered to most cluttered, least distracting to most distracting, best spot to worst spot...
Or have the children try to create a map based on travel time by public transportation, a so-called isochronous map. According to the travel planner, the trip from Utrecht to Zwolle takes 0:50 (or longer). From Utrecht to 't Harde, the trip takes 1:01. On this map, 't Harde is therefore farther from Utrecht than Zwolle. From Utrecht to Zaandam Kogerveld takes 1:00. On this map, Zaandam Kogerveld and 't Harde are therefore the same distance from Utrecht (on the same circle). You could select a series of locations around your school and have the children create a travel time map of their surroundings.
The SASMO is an international math competition organized by a group in Singapore. Many problems resemble puzzles more than mathematical research. These are problems that can be fun to present to the class every now and then and let the children puzzle over. Focus more on reasoning than on calculation with these questions. For example
Look at the following series of sums
11+12+13+14+15+16+17+18+19+20=155
21+22+23+24+25+26+27+28+29+30=255
31+32+33+34+35+36+37+38+39+40=355
41+42+43+44+45+46+47+48+49+50=455
51+52+53+54+55+56+57+58+59+60=555
What is the sum of the numbers 101 through 110?
Or, for example, this puzzle: what should go in place of the question mark?
| 6 | 8 | 11 |
| 12 | 15 | 19 |
| 8 | ? | 15 |
In the SASMO test, they also provide four possible answers (9, 12, 11, 13). I’m not sure if I would include those.
The reasoning behind this problem isn’t immediately obvious. It requires recognizing a pattern in the differences between the numbers.
| 2 | 3 | |||
| 6 | → | 8 | → | 11 |
| 3 | 4 | |||
| 12 | → | 15 | → | 19 |
| □ | □+1 | |||
| 8 | → | ? | → | 15 |
Now you need to look at the jumps in the bottom row.
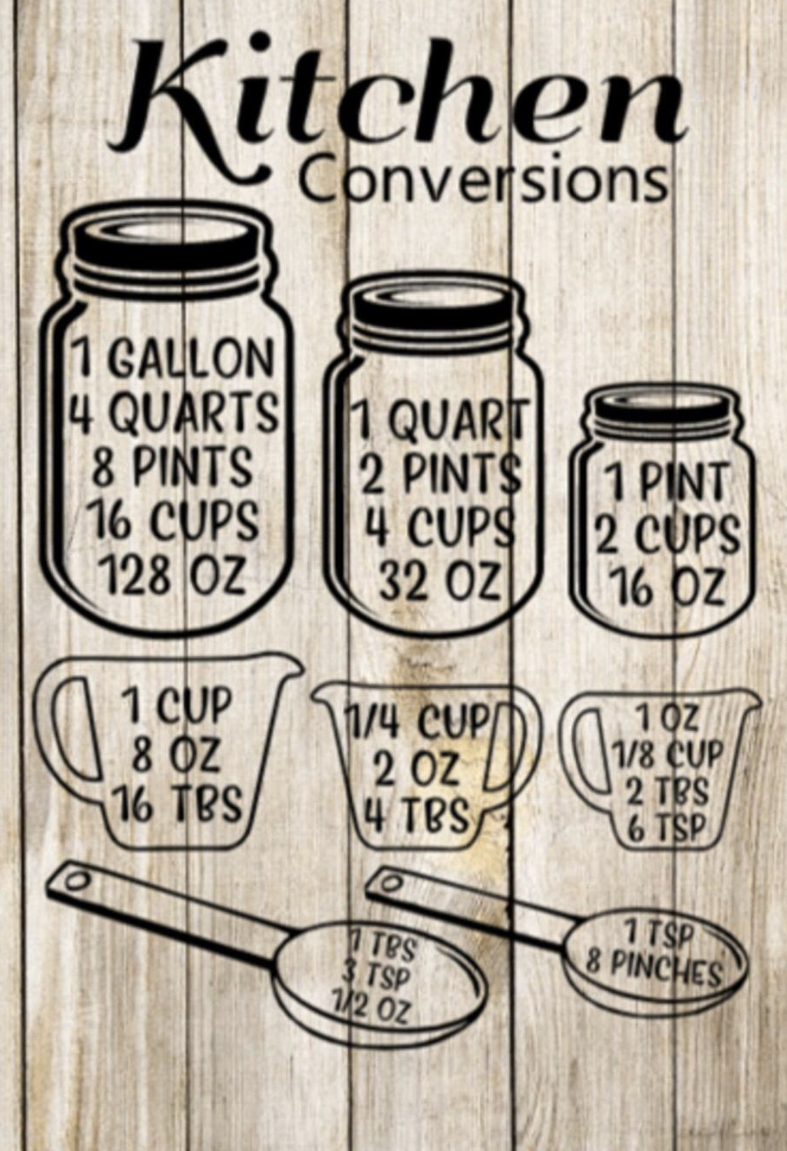
Converting measurements
Cooking involves recipes and measurements. Some recipes call for grams and milliliters, others for teaspoons or tablespoons. What exactly is what? It’s quite tricky to determine exactly how much you need. 1 teaspoon (tsp) is 5 ml and 1 tablespoon (tbsp) is 15 ml. So 3 teaspoons is 1 tablespoon. But of course, not everything weighs the same. Roughly speaking, 1 tablespoon of salt is about 10 grams, and 1 tablespoon of rice is around 12.5 grams. Cooking gets even more complicated when you look at an American recipe. Then it’s suddenly all about cups, pounds (lb), ounces (oz), quarts, and pints. It’s enough to drive you crazy. That’s why many people don’t use regular spoons but measuring spoons and measuring cups. That way, you can be sure you’re getting it right. It’s a shame, though, because it involves a lot of proportion calculations.
This table shows that it’s not easy for Americans either. It also shows that creating a chart like this can be a great challenge for students.
| oz. | tbsp. | cups | pints | quarts | gallons |
|---|---|---|---|---|---|
| 1 oz. | 2 | ⅛ | - | - | - |
| 8 oz. | 16 | 1 | ½ | - | - |
| 16 oz. | 32 | ½ | - | ||
| 4 | ¼ | ||||
| 4 | 2 | ||||
| 16 | 8 | 1 |
The table is only half filled in. Can you fill it in completely?
We can also create a table like this for common Dutch measurements. For example, the weight of certain products in grams. To make calculations easier, I’ve included cups and fractions of cups in the table.
| Ingredient (g) | 1 cup | ¾ cup | ⅓ cup | 1 tablespoon | 1 teaspoon |
|---|---|---|---|---|---|
| Sugar | 64 | 4 | |||
| Butter | 240 | 80 | |||
| Salt | 18 | 6 | |||
| Flour | 144 | 9 | 3 | ||
| Raisins | 120 | 10 | |||
| Mayonnaise | 224 | 14 |
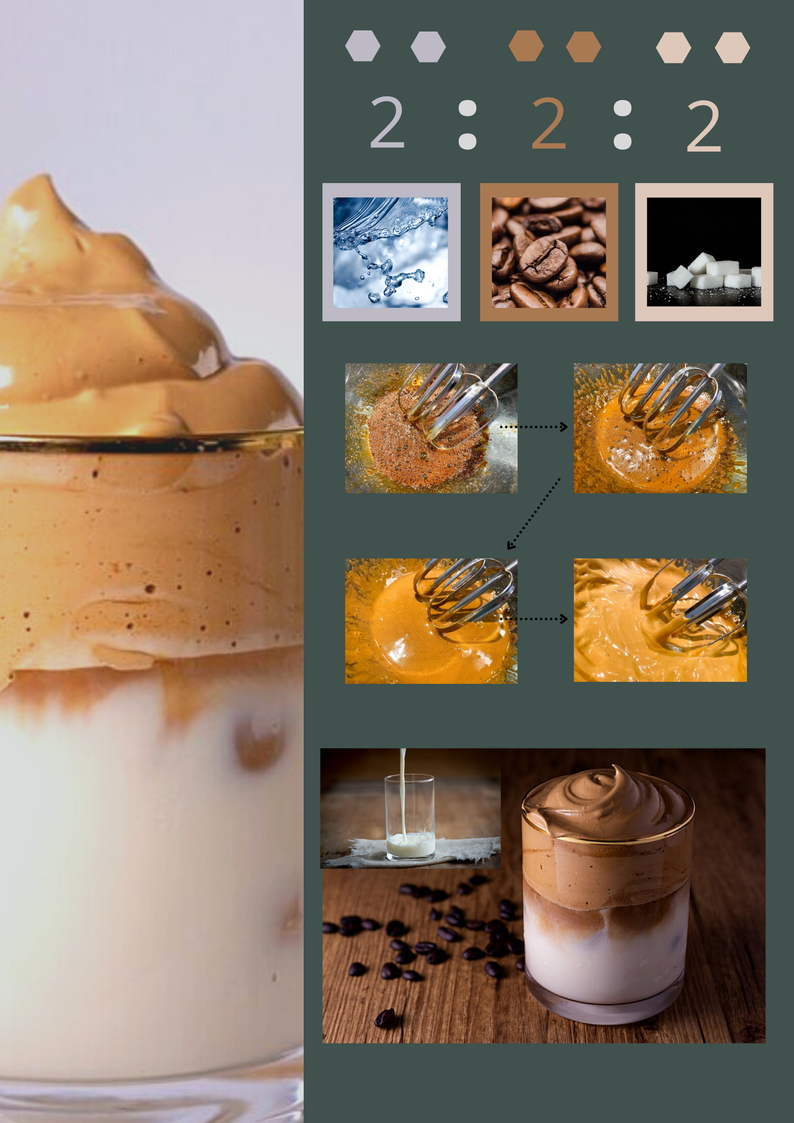
Posters about recipes
The IDM 2021 also produced some great posters on cooking and math. On their website, you can view other posters and read about who created them and what inspired them.
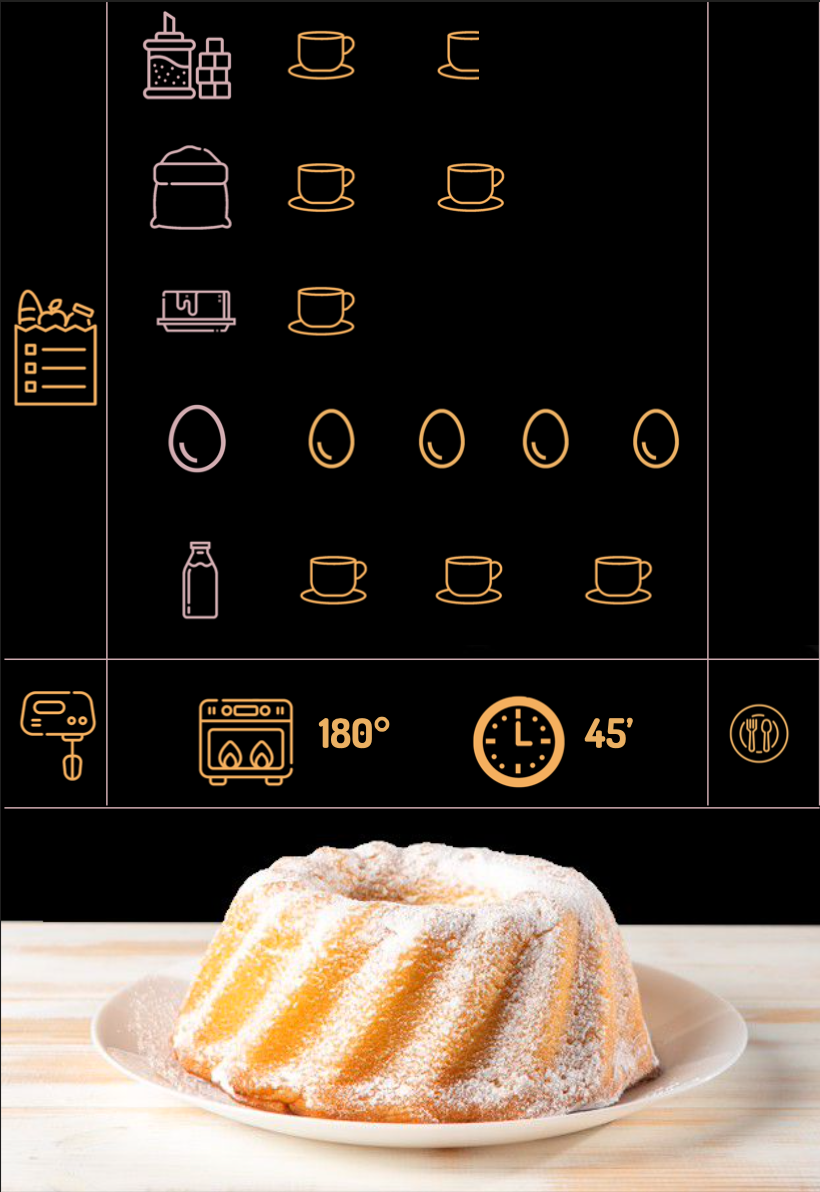
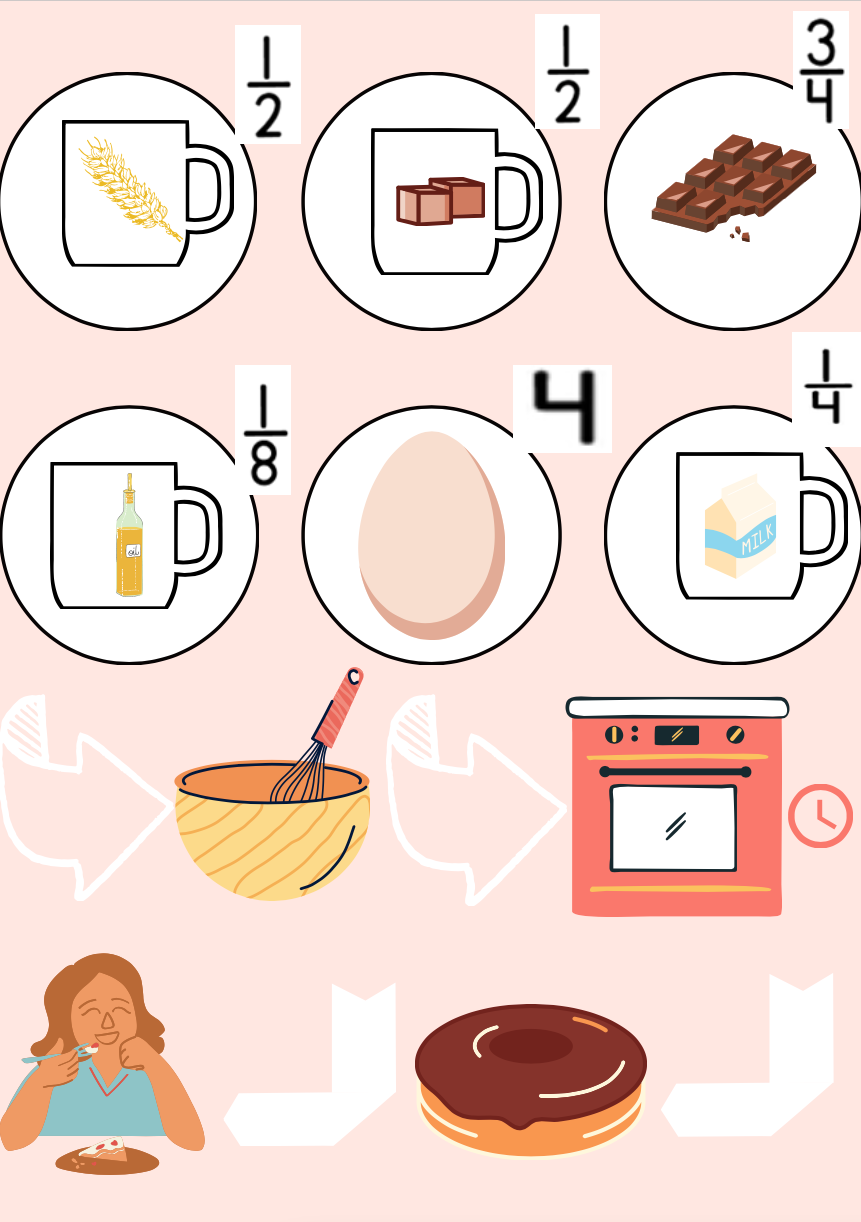
Baking a cake
Also check out Baking a Cake Is Math.
| ©2026 Inspiration4Learning — All rights reserved |
